• Home
  • Buyers
    • Buyer’s Guide
    • For Buyers
    • Buyer Wish List
  • Sellers
    • Seller’s Guide
    • For Sellers
    • Property Updates
    • Marketing & Listing Proposal 2019
    • Prepare your house For Sale
    • How much is my house worth today?
  • City Info
    • Search All Towns USA
    • Community Reports
    • Anaheim
    • Brea
    • Orange
    • Fullerton
    • La Habra
    • Placentia
    • Santa Ana
    • Yorba Linda
  • News
  • Schools
  • Contact Us

Roy Hernandez Real Estate Services

Orange county real estate houses for sale

You are here: Home / Archives for whittier houses for sale

OC Housing Report: The Sky is NOT Falling

August 15, 2019 By Roy Hernandez Leave a Comment

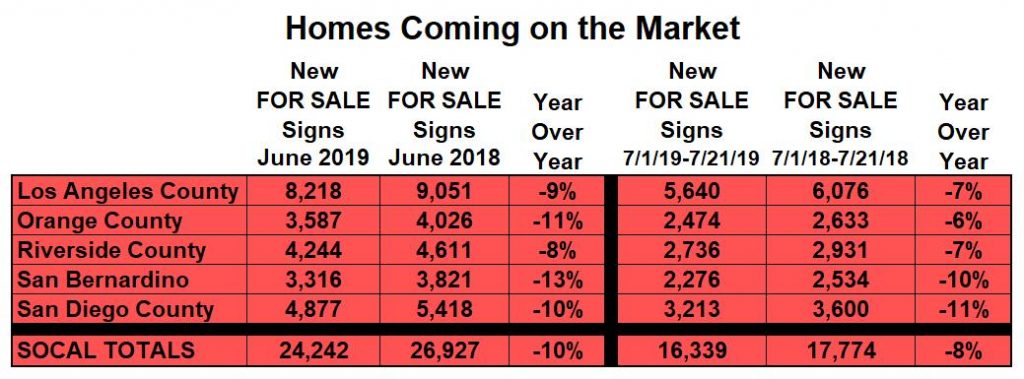
Buyer demand may not be as hot as prior years, but the Housing market is not collapsing either.

No Housing Collapse: The underlying housing fundamentals have stabilized significantly compared to last year’s slide.

Little kids often have a tough time climbing under the covers and swiftly dozing off to sleep. Instead, they look under their bed to make sure there is nothing there. They look in their closet and then close the door tight. They make certain that the nightlight is brightly shining. There are even times when they will ask dad or mom to be absolutely certain that there are no monsters in their room. Finally, they anxiously fall asleep.

For buyers or sellers wondering if there are any monsters lurking around the corner, they can be rest assured that the sky is not falling, there are no surprises on the housing front anytime soon. Reports from the housing trenches are that many buyers expect the market to drop like a rock and that is when they will finally be able to purchase. That simply is not on the horizon. Sitting back and waiting on the sidelines will prove to be a waste of time.

Last year, major cracks in the housing market emerged. The HOT market continued from 2012 through the start of 2018, until the underlying fundamentals quickly eroded. From May through August of last year, the active inventory climbed by 17%, demand dropped by 10%, and the Expected Market Time (the amount of time it would take from hammering in the FOR SALE sign to opening escrow) rocketed upward. The Expected Market Time continued to soar by climbing an additional 56% from August through the end of the year, compared to a 7% average from 2012 through 2017.

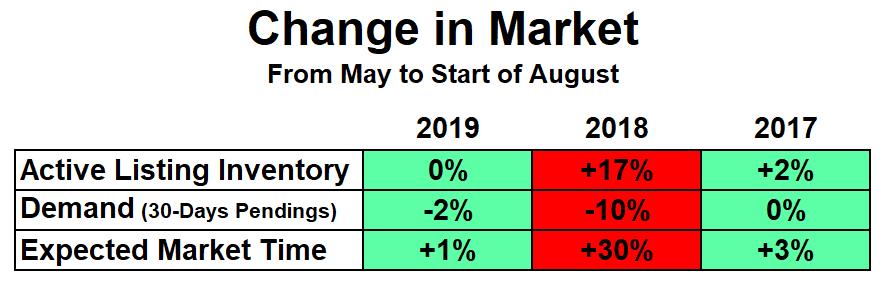
This year, from May to the start of August, the active inventory has remained unchanged, demand has only dropped by 2%, and the Expected Market Time increased by only 1%. Housing is not grinding to a halt. The sky is not falling. Typically for this time of the year, the Summer Market, the active inventory rises, demand drops slightly, and the Expected Market time slowly increases. This year, there has not been much change at all.

Orange County housing has improved dramatically since all the cracks of last year. But that does NOT mean that the market is back on track and will rapidly appreciate like it did before. Take a closer look at demand. It is up 9% compared

to last year. But, do NOT get too excited in comparing the market this year to last year. The numbers are going to look great for the rest of the year compared to 2018. However, housing grinded to a halt from July to the end of 2018. A better comparison is to look at the market when it was hot, improving, and appreciating.

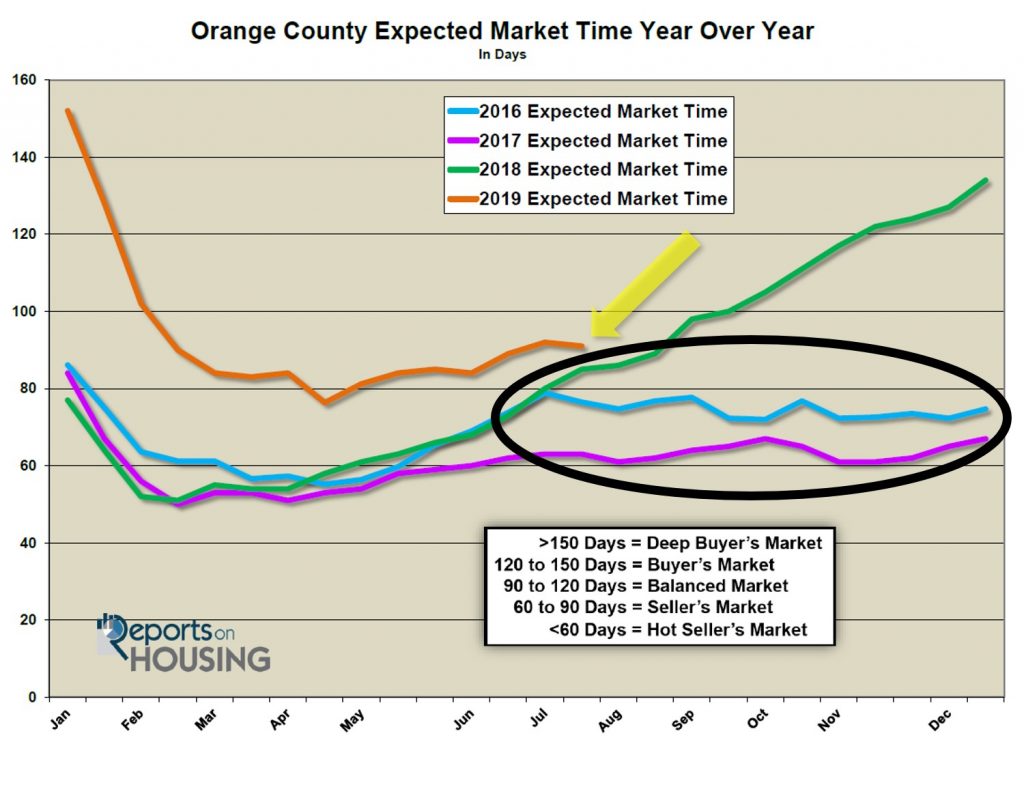
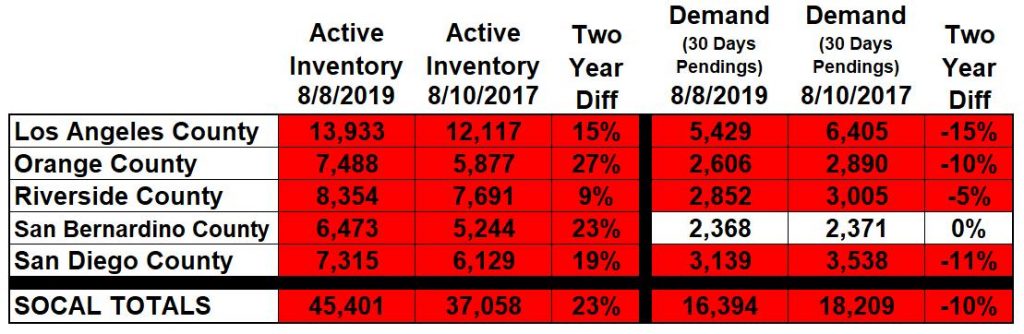
Contrasting this year to 2017 paints a much better picture as to where local real estate is heading. Demand in Orange County is off by 10% compared to 2017. It is still muted, just not sliding off a cliff like it was last year. The inventory is up by 27% compared to two years ago. The Expected Market Time is at 86 days compared to 61 days in 2017.  

It is time for everybody’s expectations to be adjusted. The market is not as hot as before. Housing is not sliding into the abyss. Property values are not skyrocketing right now, but they are not falling either. Local real estate is not changing that much; what you see is what you get. Low mortgage rates have saved the day and they are not going anywhere. Instead, they are on the decline, reaching three-year lows. These low rates will cushion the market from stalling.

The Expected Market Time today is 86 days, identical to last year. Unlike last year, when it climbed to 134 days by year’s end, it will only rise slightly from here. At 86 days it is a slight Seller’s Market. That is a market that is characterized by not a lot of appreciation, but sellers get to call more of the shots during negotiations. It will most likely move to a Balanced Market from here, one that does not favor sellers or buyers. The market is hottest in the lower ranges where there are more multiple offers and sales prices are closer to their list prices. As the price climbs above $1 million, the market slows considerably, Expected Market Times climb, multiple offers are NOT the norm, sales prices are not as close to their asking prices, and there are a lot fewer success stories.

The bottom line: while housing is not as robust today as prior years, it is not spiraling out of control and will not result in a housing downturn anytime soon. The sky is not falling.

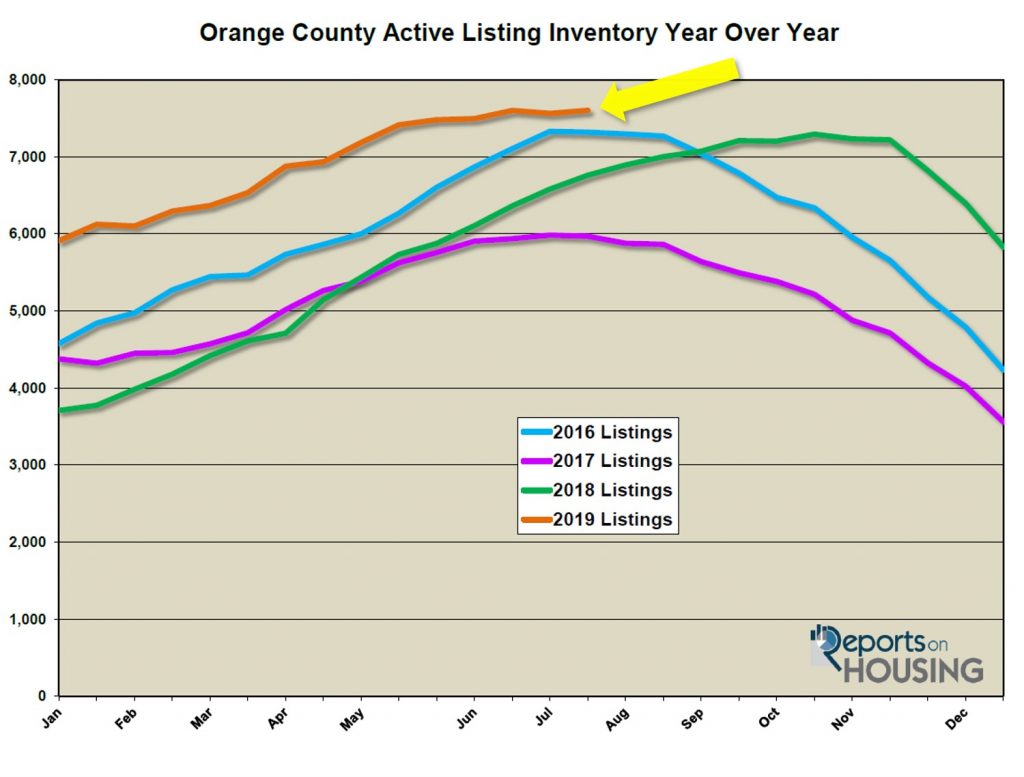
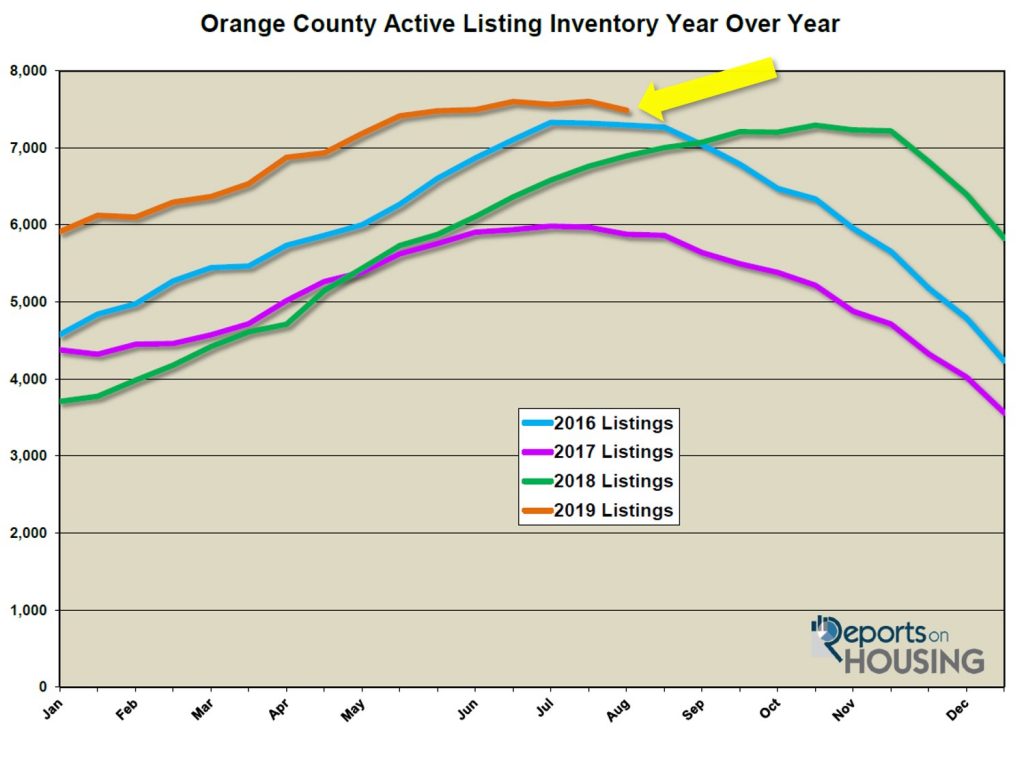
Active Inventory: The current active inventory shed 113 homes in the past two-weeks. In the past two-weeks, the active listing inventory dropped by only 113 homes, down 1%, and now totals 7,488. It looks as if the housing peak occurred two weeks ago and will drop from here. In comparing this year to last year, the difference at the beginning of the year was staggering. There were 2,204 more homes than 2018 at the start of January, 59% more. Today, there are 595 more homes compared to last year in August, 9% more. The difference is dissipating and within the next month, there will be fewer homes compared to the prior year.

From now through the end of the year, the active listing inventory will slowly drop, and will pick up speed during the holidays when fewer homes come on the market and many unsuccessful sellers pull their homes off the market.

Demand: In the past two-weeks, demand increased by 4%.  Demand, the number of new pending sales over the prior month, increased by 101 pending sales in the past two-weeks, up 4%, and now totals 2,606. It is the largest gain for the beginning of August since 2013. In the coming weeks ahead, the market will be transitioning to the Autumn Market when fewer homes come on the market and demand begins to dip slowly, leaving behind the two best times of the year in terms of activity, the Spring and Summer Markets. It will slowly decline for the remainder of the year, picking up steam during the holidays.

Last year at this time, there were 212 fewer pending sales than today. Current demand is still muted, just not as severe as this time last year when interest rates were climbing. Two years ago, it was 11% stronger than today.

The current Expected Market Time decreased from 91 days to 86 days in the past two weeks, a slight Seller’s Market (60 to 90 days), where sellers get to call more of the shots during a negotiation and property values are not increasing by much. Last year, the Expected Market Time was at 86 days, identical to today.

Luxury End:  The luxury market improved in the past couple of weeks. In the past two-weeks, demand for homes above $1.25 million increased by 15 pending sales, a 5% increase, and now totals 331. The luxury home inventory decreased by 44 homes and now totals 2,507, a 2% drop after reaching a height for the year two-weeks ago. The overall Expected Market Time for homes priced above $1.25 million decreased from 242 days to 227 over the past two-weeks, still sluggish.

Year over year, luxury demand is the same and the active luxury listing inventory is up by an additional 355 homes, or 16%. Extra seller competition and continued muted demand is a trend that will persist for the remainder of the year. The expected market time last year was at 195 days, better than today.

For homes priced between $1.25 million and $1.5 million, in the past two-weeks, the Expected Market Time decreased from 147 to 130 days. For homes priced between $1.5 million and $2 million, the Expected Market Time increased from 240 to 244 days. For homes priced between $2 million and $4 million, the Expected Market Time decreased from 288 to 280 days. For homes priced above $4 million, the Expected Market Time decreased from 500 to 404 days. At 404 days, a seller would be looking at placing their home into escrow around September 2020.

Orange County Housing Market Summary:

  • The active listing inventory decreased by 113 homes in the past two-weeks, down 1%, and now totals 7,488. The inventory most likely reached a peak for the year of 7,601 two weeks ago. Last year, there were 6,893 homes on the market, 595 fewer than today. There are 9% more homes than last year.
  • Demand, the number of pending sales over the prior month, increased by 101 pending sales in the past two-weeks, up 4%, and now totals 2,606. Last year, there were 2,394 pending sales, 9% fewer than today.
  • The Expected Market Time for all of Orange County decreased from 91 days two weeks ago to 86 days today, a slight Seller’s Market (between 60 to 90 days). It was at 86 days last year.
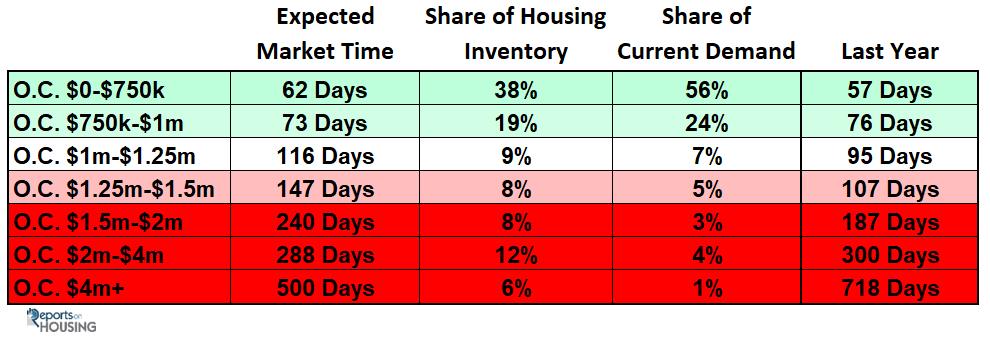
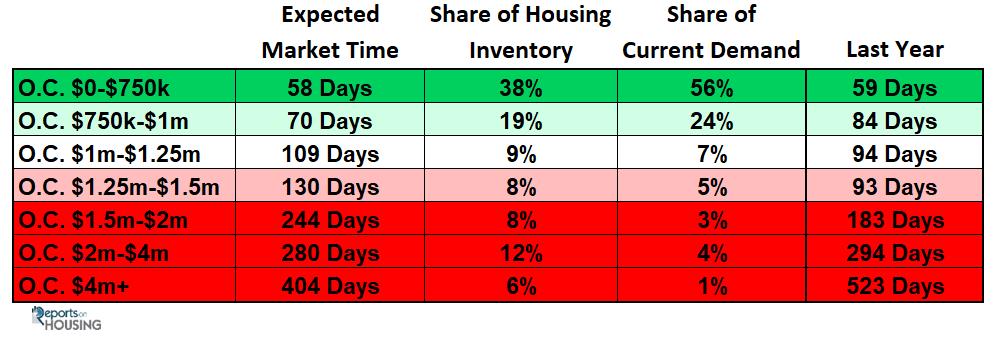
  • For homes priced below $750,000, the market is a hot Seller’s Market (less than 60 days) with an expected market time of 58 days. This range represents 38% of the active inventory and 56% of demand.
  • For homes priced between $750,000 and $1 million, the expected market time is 70 days, a slight Seller’s Market. This range represents 19% of the active inventory and 24% of demand.
  • For homes priced between $1 million to $1.25 million, the expected market time is 109 days, a Balanced Market.
  • For luxury homes priced between $1.25 million and $1.5 million, in the past two weeks, the Expected Market Time decreased from 147 to 130 days. For homes priced between $1.5 million and $2 million, the Expected Market Time increased from 240 to 244 days. For luxury homes priced between $2 million and $4 million, the Expected Market Time decreased from 288 to 280 days. For luxury homes priced above $4 million, the Expected Market Time decreased from 500 to 404 days.
  • The luxury end, all homes above $1.25 million, accounts for 34% of the inventory and only 13% of demand.
  • Distressed homes, both short sales and foreclosures combined, made up only 0.8% of all listings and 1.4% of demand. There are only 20 foreclosures and 37 short sales available to purchase today in all of Orange County, 57 total distressed homes on the active market, up one in the past two-weeks. Last year there were 88 total distressed homes on the market, slightly more than today.
  • There were 2,871 closed residential resales in July, 5% more than July 2018’s 2,734 closed sales. July marked a 6% increase compared to June 2019. The sales to list price ratio was 98.3% for all of Orange County. Foreclosures accounted for just 0.5% of all closed sales, and short sales accounted for 0.24%. That means that 99.3% of all sales were good ol’ fashioned sellers with equity.

Article courtesy of Steven Thomas Quantitative Economics and Decision Sciences.

Sincerely,
Roy Hernandez
TNG Real Estate Consultants
Cell 949.922.3947

Filed Under: orange county real estate news Tagged With: la habra houses for sale, whittier houses for sale

OC Housing Report- Staying Put

July 29, 2019 By Roy Hernandez Leave a Comment

Hello!

It is the Summer Market yet there are fewer new FOR SALE signs this year.

Fewer Listings: Not as many homeowners are placing their homes on the market than what is typical for this time of the year.

The lazy days of summer are here. Sitting in the back yard under the umbrella drinking a tall cold glass of lemonade, nothing beats it. Time seems to stand still. The pressures of the rat race of life fade for a moment while basking in the warm summer air. It is a welcome break from the fast pace of working so hard.

The summer of 2019 is shaping up to be quite the same way for housing, many homeowners are kicking back in their homes and enjoying the warmer weather rather than placing their homes on the market.

In Orange County, there were 11% fewer homes that came on the market in June of this year compared to June of 2018. That equates to 439 FOR SALE signs. So far in July, there are 6% fewer, or 159 missing FOR SALE signs year-over-year. For buyers monitoring local housing closely, they have witnessed this recent phenomenon. There simply are not as many new homes coming on for buyers to tour.

With not as many homes entering the fray, the active listing inventory is not growing as fast as is typical for the Summer Market. In June and July, the inventory has only grown by 122 homes, or 2%. From 2013 through 2018, on average, it has grown by 819 homes, or 15%. The limited number of homes coming on the market this year has had an impact on the overall choices for buyers.

For sellers desiring an even hotter housing market, that is not what is going on here. Instead, the Expected Market Time (the time it would take for a home that comes on the market today to enter escrow down the road) is not slowing as much as it normally does during the summer time. At the end of May, it was at 85 days. Today, it is at 91 days. That is only an increase of 6 days compared to the average from 2013 through 2018 of 15 days. At 91 days, Orange County is experiencing a Balanced Market (from 90 to 120 days), one that does not favor sellers or buyers. Nobody is in the driver’s seat in a market that is balanced, home values do not change, and there are fewer multiple offer situations.

Had the typical number of homes come on the market, it would be a deeper Balanced Market. This is more than just a blip on the housing radar. It is a trend that will ultimately impact the overall feel and trajectory of the market for the remainder of 2019. Fewer FOR SALE signs translates to fewer choices and a stronger Expected Market Time. Summer is a time when demand softens a bit as the supply of homes increases. That continues until housing transitions to the Autumn Market, where the Expected Market Time remains relatively the same for the rest of the year. With the growth in the supply of homes slowing early, it means the Expected Market Time will not change much from the summer through the end of the year. When the kids go back to school, even fewer homes come on the market while buyer demand diminishes. With both supply and demand falling at nearly the same rate, not much changes in the overall feel of housing.

Last year, the big story was a giant drop in demand (the number of pending sales in the last month), especially noticeable from mid-July through the end of the year. The drop in demand was exasperated by rising interest rates, climbing from 4.5% to 5% from July through November. That translated to an increasing Expected Market Time through the end of the year. That is not going to occur this year while interest rates remain at a three-year low, around 3.75%.

Why are there fewer FOR SALE signs popping up in neighborhoods across Southern California? It could be the deluge of negative housing stories swirling across the nation. It could be all the talk of a pending recession. It is anybody’s guess at this point. Collectively, more homeowners are sitting in their back yards, sipping an ice-cold glass of lemonade, and enjoying the summer warmth, instead of coming on the market and participating in the game of real estate.

Active Inventory: The current active inventory increased by 40 homes in the past two-weeks.

In the past two-weeks, the active listing inventory increased by only 40 homes, up 0.5%, and now totals 7,601. That beats the 2019 height reached a month ago by one extra home. This could be the peak for 2019, unless it climbs one more time over the coming two weeks. From there, housing will transition to the Autumn Market. With both the Spring and Summer Markets in the rearview mirror, fewer homeowners place their homes on the market and many unsuccessful sellers throw in the towel and pull their homes off the market. The active listing inventory will drop for the remainder of the year.

Last year at this time there were 6,759 homes on the market. That means that there are 12% more homes available today. This continues to be the highest level of homes on the market for this time of the year since 2011. Soon, there will be fewer homes on the market this year compared to 2018. The inventory will be dropping at a time when it was increasing last year.

Demand: In the past two- weeks, demand increased by 2%. 

Demand, the number of new pending sales over the prior month, increased by 44 pending sales in the past two-weeks, up 2%, and now totals 2,505. From here, expect demand to rise slightly over the coming two weeks, a last hurrah for the Summer Market. Then, it will transition into the Autumn Market where demand will methodically fall for the remainder of the year.

Last year at this time, there were 112 fewer pending sales, fewer than today. Current demand is still muted, just not as severe as this time last year when interest rates were climbing. Two years ago, it was 13% stronger than today.

The current Expected Market Time decreased from 92 days to 91 days in the past two weeks, a Balanced Market (90 to 120 days), one that does not favor sellers or buyers. Last year, the Expected Market Time was at 85 days, slightly better than today.

Luxury End:  The luxury market slowed considerably in the past couple of weeks.

In the past two-weeks, demand for homes above $1.25 million decreased by 29 pending sales, an 8% drop, and now totals 316, its lowest level since February. The luxury home inventory increased by 29 homes and now totals 2,551, a 1% rise and the highest level of the year. The overall Expected Market Time for homes priced above $1.25 million increased from 219 days to 242 over the past two-weeks, extremely sluggish.

Year over year, luxury demand is up by 3 pending sales, or 1%, and the active luxury listing inventory is up by an additional 359 homes, or 16%. Extra seller competition and continued muted is a trend that will persist for the remainder of the year. The expected market time last year was at 210 days, better than today. For homes priced between $1.25 million and $1.5 million, in the past two-weeks, the Expected Market Time increased from 143 to 147 days. For homes priced between $1.5 million and $2 million, the Expected Market Time increased from 189 to 240 days, the largest shift at the luxury end. For homes priced between $2 million and $4 million, the Expected Market Time increased from 262 to 288 days. For homes priced above $4 million, the Expected Market Time decreased from 518 to 500 days. At 500 days, a seller would be looking at placing their home into escrow around December 2020.

Orange County Housing Market Summary:

  • The active listing inventory increased by 40 homes in the past two-weeks, up 0.5%, and now totals 7,601, the highest level for 2019. In the month of June, 11% fewer homes came on the market compared to June 2018. And, so far in July, it is down by 6%. Last year, there were 6,759 homes on the market, 842 fewer than today. There are 12% more homes than last year.
  • Demand, the number of pending sales over the prior month, increased by 44 pending sales in the past two-weeks, up 2%, and now totals 2,505. Last year, there were 2,393 pending sales, 4% fewer than today.
  • The Expected Market Time for all of Orange County decreased from 92 days two weeks ago to 91 days today, a Balanced Market (between 90 to 120 days) and the highest level for this time of the year since 2011. It was at 85 days last year.
  • For homes priced below $750,000, the market is a slight Seller’s Market (between 60 and 90 days) with an expected market time of 62 days. This range represents 39% of the active inventory and 56% of demand.
  • For homes priced between $750,000 and $1 million, the expected market time is 73 days, a slight Seller’s Market. This range represents 19% of the active inventory and 24% of demand.
  • For homes priced between $1 million to $1.25 million, the expected market time is 116 days, a Balanced Market.
  • For luxury homes priced between $1.25 million and $1.5 million, in the past two weeks, the Expected Market Time increased from 143 to 147 days. For homes priced between $1.5 million and $2 million, the Expected Market Time increased from 189 to 240 days. For luxury homes priced between $2 million and $4 million, the Expected Market Time increased from 262 to 288 days. For luxury homes priced above $4 million, the Expected Market Time decreased from 518 to 500 days.
  • The luxury end, all homes above $1.25 million, accounts for 34% of the inventory and only 13% of demand.
  • Distressed homes, both short sales and foreclosures combined, made up only 0.7% of all listings and 1.4% of demand. There are only 22 foreclosures and 34 short sales available to purchase today in all of Orange County, 56 total distressed homes on the active market, up one in the past two-weeks. Last year there were 59 total distressed homes on the market, nearly the same as today.
  • There were 2,715 closed residential resales in June, 6% fewer than June 2018’s 2,879 closed sales. June marked a 7% drop from May 2019. The sales to list price ratio was 97.6% for all of Orange County. Foreclosures accounted for just 0.5% of all closed sales, and short sales accounted for 0.4%. That means that 99.1% of all sales were good ol’ fashioned sellers with equity.

Article courtesy of Steven Thomas Quantitative Economics and Decision Sciences

Have a great week.

Roy Hernandez
TNG Real Estate Consultants

Cell      949.922.394

Filed Under: orange county real estate news Tagged With: la habra houses for sale, whittier houses for sale

RoyaltyAgent@gmail.com

Search All Houses FOR SALE

Hot Bank Foreclosures & REO

Current Mortgage Rates

[mlrates state="CA" size="narrow"]

Fullerton Homes FOR SALE by Price

$300,000- $500,000
$500,000- $700,000
$700,000- $900,000
$900,000- $1,100,000
$1,100,000 and above

Fullerton Condos FOR SALE by Price

$200,000- $300,000
$300,00- $400,000
$400,000 and above

Our Coverage Areas

Brea Homes FOR SALE

Brea North Hills FOR SALE

Whittier Homes FOR SALE

Fullerton Homes FOR SALE

Placentia Homes FOR SALE

La Habra Homes FOR SALE

Yorba Linda Homes FOR SALE

Anaheim Homes FOR SALE

Brea Special Events

Community Reports

downtown brea

City Information


Brea

Yorba Linda

Placentia

Fullerton

La Habra

Tag Cloud

Anaheim Hills real estate for sale Anaheim house for sale bank owned Brea bank owned for sale Brea community info Brea foreclosure for sale Brea house for sale Brea houses for sale Brea real estate Brea real estate for sale Brea REO Brea REO for sale buyer real estate news foreclosure for sale Fullerton house FOR SALE Fullerton houses for sale Fullerton real estate Fullerton Real Estate For Sale fullerton resort living housing data housing market housing news la habra houses for sale La Habra real estate for sale north orange county for sale north orange county real estate orange county housing info orange county real estate Orange county real estate for sale orange county shadow inventory placentia condos for sale placentia for sale placentia homes for sale placentia houses for sale placentia real estate real estate information real estate news orange county REO for sale REO property for sale seller information whittier houses for sale Yorba Linda for sale Yorba Linda homes for sale yorba linda houses for sale Yorba Linda real estate for sale
The Virtual Realty Group
Roy Hernandez
cell/text (949) 922-3947
RoyaltyAgent @ gmail.com
RoyalAgent.net
BRE#01202958
  • Blog Page
  • I’d like to sell my house
  • About

Copyright © 2025 Website by The Burrell Group · Log in