• Home
  • Buyers
    • Buyer’s Guide
    • For Buyers
    • Buyer Wish List
  • Sellers
    • Seller’s Guide
    • For Sellers
    • Property Updates
    • Marketing & Listing Proposal 2019
    • Prepare your house For Sale
    • How much is my house worth today?
  • City Info
    • Search All Towns USA
    • Community Reports
    • Anaheim
    • Brea
    • Orange
    • Fullerton
    • La Habra
    • Placentia
    • Santa Ana
    • Yorba Linda
  • News
  • Schools
  • Contact Us

Roy Hernandez Real Estate Services

Orange county real estate houses for sale

You are here: Home / Archives for placentia houses for sale

OC Housing Report: Green Shoots

September 12, 2019 By Roy Hernandez Leave a Comment

Good evening!

Even though the housing market is not as hot as prior years,trends have emerged that confirm that it is starting to heat up.

Green Shoots: Trends are developing which demonstrate that the housing cool down is beginning to heat up.

Headlines are the same across the country: there are more homes on the market and it is taking a lot longer to sell a home. Multiple offers and instantaneous success are characteristics of housing a couple of years ago. After many years of rapid appreciation, demand for homes slowed considerably as mortgage rates climbed to 4.5% in March 2018. Demand deteriorated further when rates unexpectedly squeezed past 5% last November.

Ever since the housing market slowed last year, demand has remained sluggish, a bit subdued in comparison to the hot years from 2012 through 2017. Those markets were characterized by a very limited inventory and sizzling demand. Yet, behind the scenes, the 2019 housing market has been boosted by falling mortgage rates. After starting the year at 4.5%, rates have dropped ever since, dipping below 4% in June for the first time since the end of 2017. Today, they sit at 3.5%, the lowest level since October 2016, nearly three years ago.

As a result of the return to historically low mortgage rates, trends have surfaced that highlight a marketplace that is heating up.

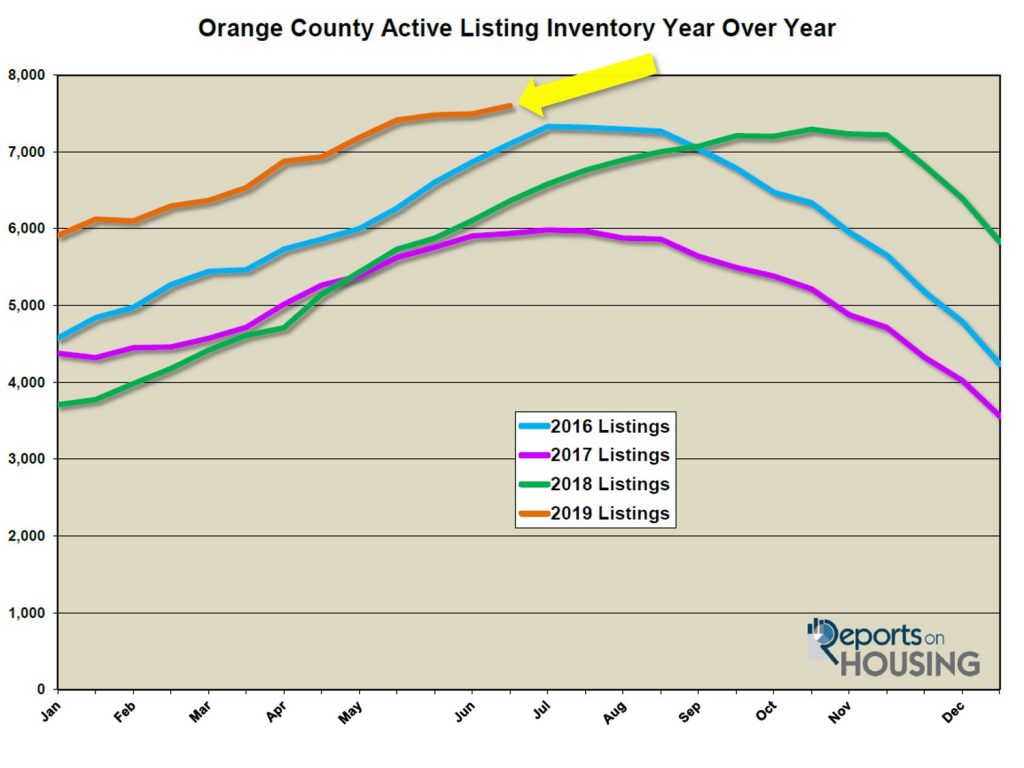
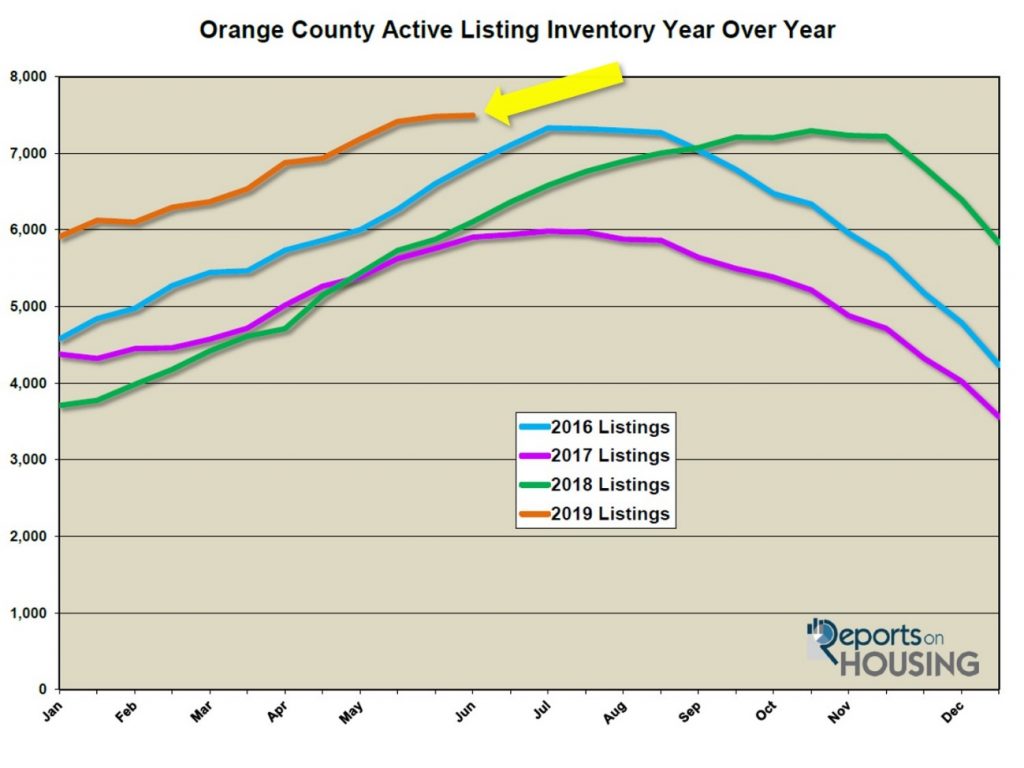
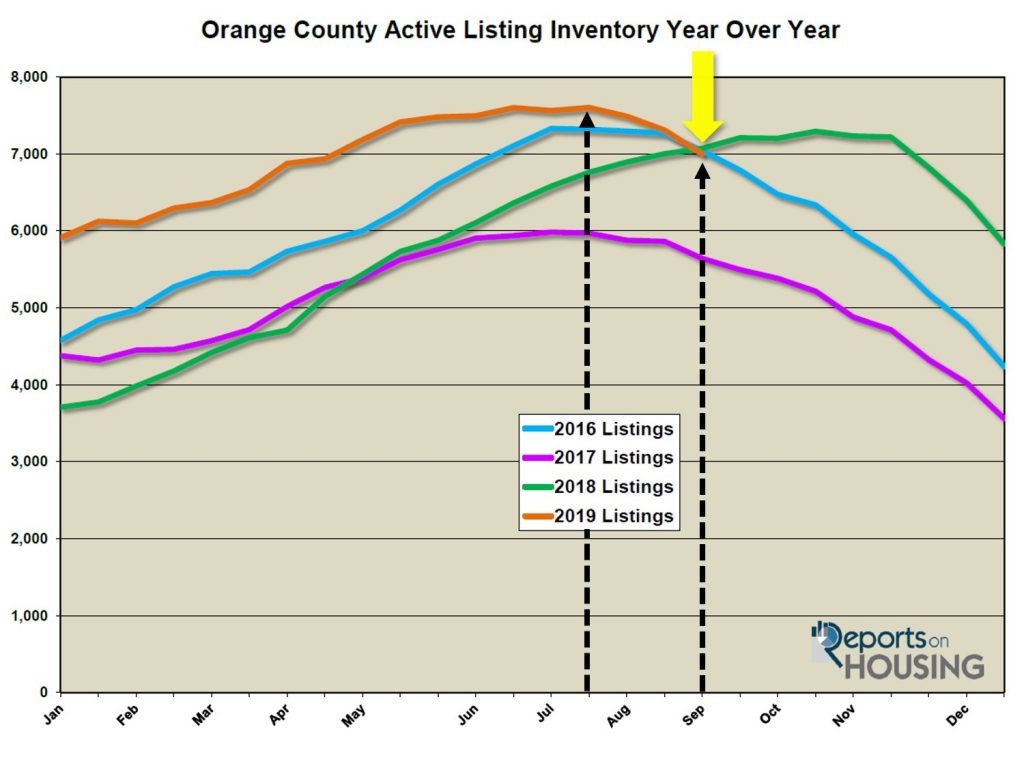
GREEN SHOOT – The current active inventory has dropped by 8% since the end of July. The inventory shed 604 homes in that time, the largest drop since 2008. Today, there are 6,997 homes on the market. It is the first time that there are fewer homes compared to the prior year since April 2018. The current trend is for a rapidly falling active inventory and fewer homes on the market than the prior year.

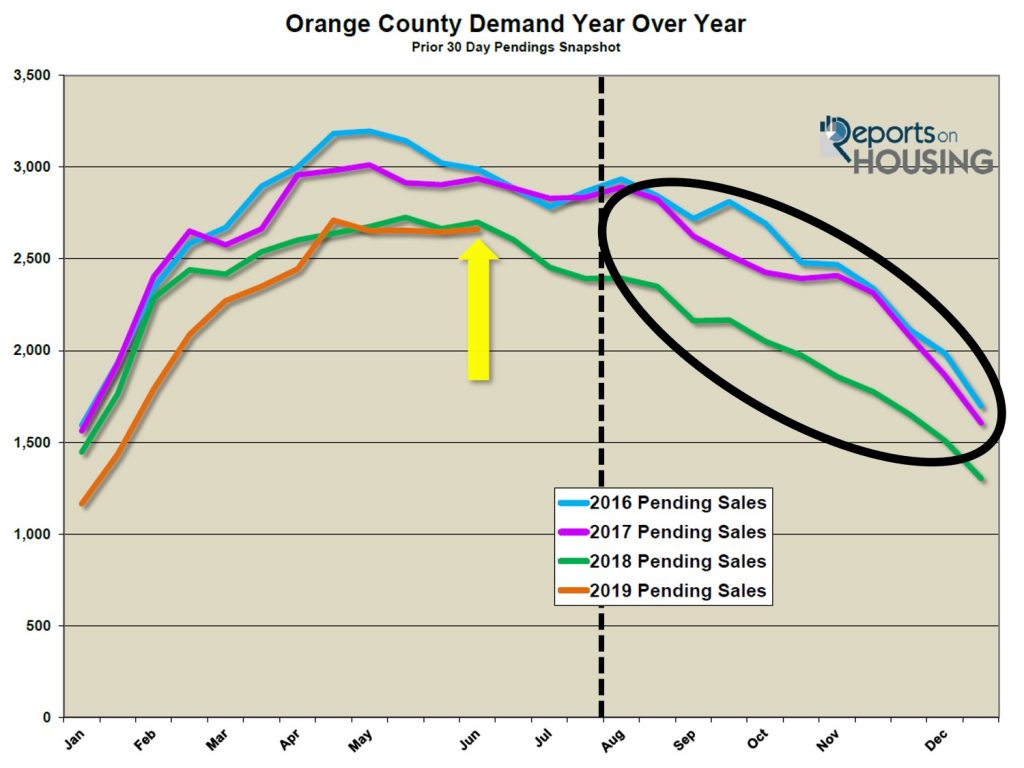
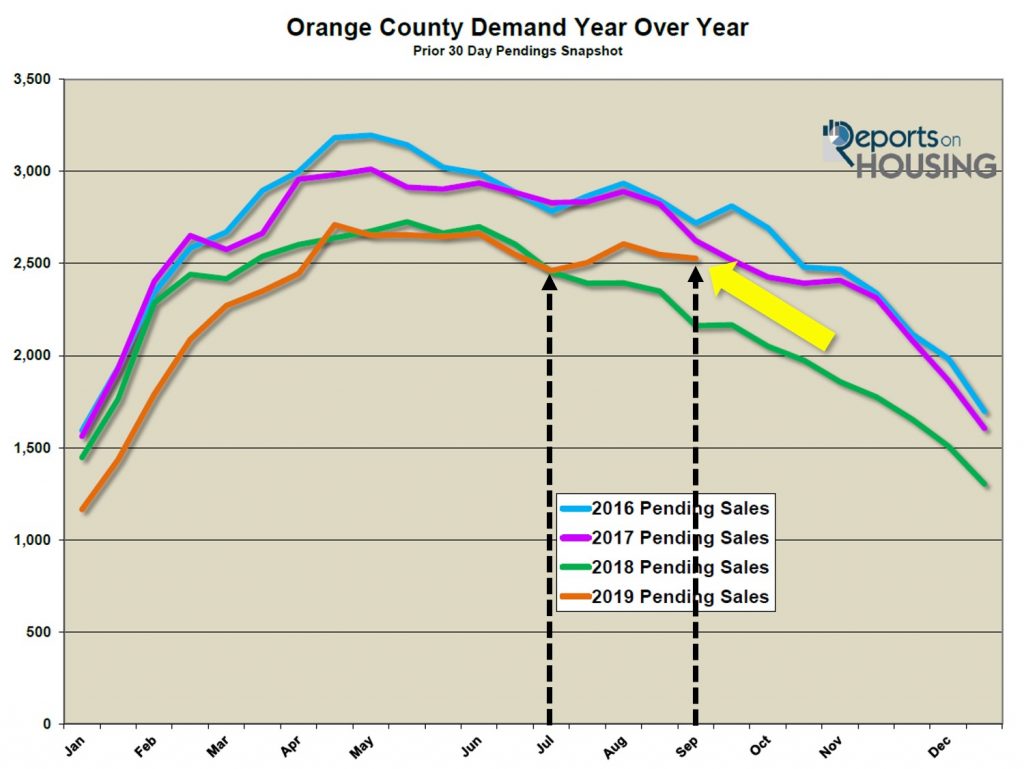
GREEN SHOOT – Demand has only dropped by 7% since peaking back in April. That is the smallest drop since 2009. On average, demand (the number of new pending sales over the prior month) has dropped by 19% after peaking in the spring. And, since mid-July, it has surprisingly increased by 3%. During that same time period, mortgage rates dropped from 3.8% to 3.5%. Lower interest rates are absolutely propping up buyer demand in Orange County.  Today, demand is at 2,528 pending sales, which is 17% higher than last year’s anemic 2,162 reading.

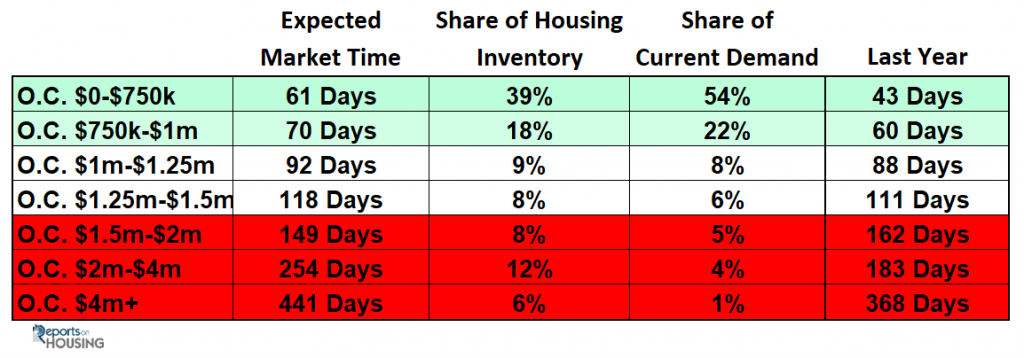
GREEN SHOOT- The Expected Market Time dropped from 92 days back in mid-July to 83 days today. Typically, from July to September the Expected Market Time (the amount of time from coming on the market to opening escrow) increases or remains flat. This year it dropped from 92 days to 83 days, a 10% dip. It was the largest decline since 2011. Last year, the Expected Market Time was at 98 days and climbed all the way to 134 days by year’s end. At 83 days, other than last year, it is still the highest level for this time of the year since 2014, but it is moving in the right direction. It is a slight Seller’s Market where homes are not appreciating much at all, but sellers get to call more of the shots during negotiations.

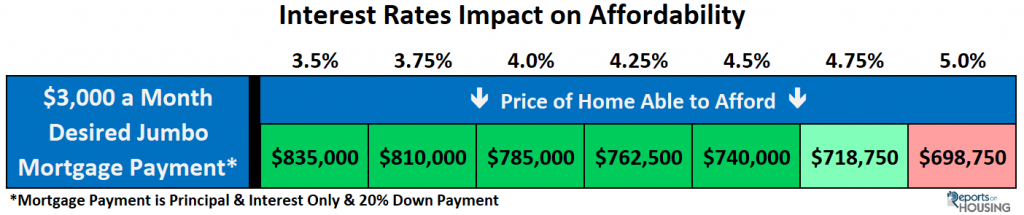
GREEN SHOOT – Affordability has dramatically improved since November of last year. So many buyers are hoping for housing to tilt in their favor and for home values to fall like they did during the Great Recession. Quite simply, that is not going to happen anytime soon. Instead, buyers really need to focus on how affordability has substantially improved since last November when rates eclipsed 5%. With mortgage rates falling back down to historically low levels, affordability is absolutely tilting in their favor. If a buyer was looking for a $3,000 monthly payment with 20% down, they would have been looking at a home priced at $698,750 in November 2018 with a 5% interest rate. Today’s 3.5% rate allows a buyer to look at homes priced at $835,000 with the exact same $3,000 per month payment. That is an extra $136,250 in a time when there has been very little appreciation in the past year. These low rates are a total gift to home buyers.

While definite green shoots have emerged, the market is still a slight Seller’s Market. It is just not as cool as the winter of 2018. These trends have slowly developed this year. The market is on track to improve further, but it will take time. The housing market will not change overnight. While promising for sellers, the market still necessitates a more cautious, deliberate strategy and approach to housing. For buyers, the current low interest rate environment is a strong advantage that has reduced the monthly mortgage payment significantly and greatly improved affordability.

Active Inventory: The current active inventory shed 310 homes in the past two-weeks.

In the past two-weeks, the active listing inventory dropped by 310 homes, down 4%, and now totals 6,997, the largest drop of the year. In the past month, it has dropped by 491 homes, a 7% plunge. The inventory will continue to drop for the rest of the year. The decline is the fastest pace since 2012. That means that there will be far fewer homes to start 2020 compared to the start of this year. The headlines once again will be an anemic inventory. 

Last year at this time, there were 7,070 homes on the market, 73 more than today, or 1%. Two years ago, there were 19% fewer homes on the market compared to today.

Demand: In the past two-weeks, demand decreased by 1%. 

Demand, the number of new pending sales over the prior month, decreased by 20 pending sales in the past two-weeks, down 1%, and now totals 2,528. Expect demand to continue to drop through the end of the year, just not at the same downward pace as is customary. Lower mortgage rates are having a positive impact on demand.

Last year at this time, there were 366 fewer pending sales than today, 14% less. Two years ago, it was 4% stronger than today.

In the past two-weeks, the Expected Market Time dropped from 86 days to 83 days, a slight Seller’s Market (60 to 90 days), where home values do not change much, and sellers get to call more of the shots during the negotiating process. Last year, the Expected Market Time was at 98 days, slower than today. Two years ago, it was at 64 days.

Luxury End:  Since July, the luxury market has continuously improved.

In the past two-weeks, demand for homes above $1.25 million decreased by only 2 pending sales, a 0.6% drop, and now totals 347. The luxury home inventory decreased by 124 homes and now totals 2,337, a 5% drop. The overall Expected Market Time for homes priced above $1.25 million decreased from 212 days to 202 over the past two-weeks, moving in the right direction.

Year over year, luxury demand is up by 28 pending sales, or 9%, and the active luxury listing inventory is up by an additional 193 homes, or 9%. The Expected Market Time last year was identical to today, 202 days. There are more luxury homes on the market, but demand is a lot stronger.

For homes priced between $1.25 million and $1.5 million, in the past two-weeks, the Expected Market Time decreased from 149 to 146 days. For homes priced between $1.5 million and $2 million, the Expected Market Time decreased from 162 to 147 days. For homes priced between $2 million and $4 million, the Expected Market Time decreased from 249 to 220 days. For homes priced above $4 million, the Expected Market Time increased from 509 to 527 days. At 527 days, a seller would be looking at placing their home into escrow around February 2021.

Orange County Housing Market Summary:

  • The active listing inventory decreased by 310 homes in the past two-weeks, down 4%, and now totals 6,997. It was the largest drop so far this year. Last year, there were 7,070 homes on the market, 73 more than today. Two years ago, there were 19% fewer homes on the market.
  • Demand, the number of pending sales over the prior month, decreased by 20 pending sales in the past two-weeks, down 1%, and now totals 2,528. Last year, there were 2,162 pending sales, 14% fewer than today. Two years ago, demand was 4% stronger than today.
  • The Expected Market Time for all of Orange County remained dropped from 86 to 83 days, a slight Seller’s Market (between 60 to 90 days). It was at 98 days last year.
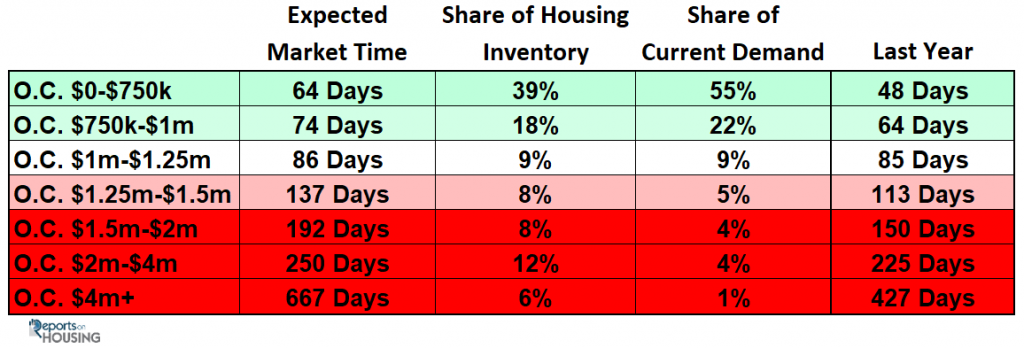
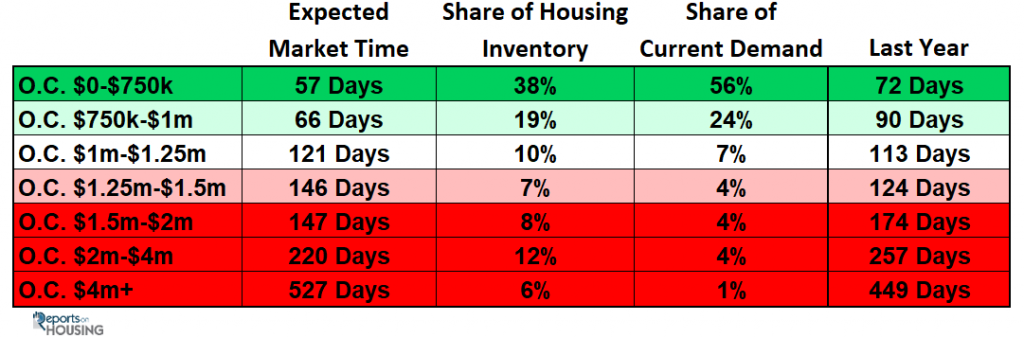
  • For homes priced below $750,000, the market is a hot Seller’s Market (less than 60 days) with an expected market time of 57 days. This range represents 38% of the active inventory and 56% of demand.
  • For homes priced between $750,000 and $1 million, the expected market time is 66 days, a slight Seller’s Market. This range represents 19% of the active inventory and 24% of demand.
  • For homes priced between $1 million to $1.25 million, the expected market time is 121 days, a Balanced Market.
  • For luxury homes priced between $1.25 million and $1.5 million, in the past two weeks, the Expected Market Time decreased from 149 to 146 days. For homes priced between $1.5 million and $2 million, the Expected Market Time decreased from 162 to 147 days. For luxury homes priced between $2 million and $4 million, the Expected Market Time decreased from 249 to 220 days. For luxury homes priced above $4 million, the Expected Market Time increased from 509 to 527 days.
  • The luxury end, all homes above $1.25 million, accounts for 33% of the inventory and only 13% of demand.
  • Distressed homes, both short sales and foreclosures combined, made up only 0.7% of all listings and 1.4% of demand. There are only 27 foreclosures and 23 short sales available to purchase today in all of Orange County, 50 total distressed homes on the active market, down two in the past two-weeks. Last year there were 56 total distressed homes on the market, slightly more than today.
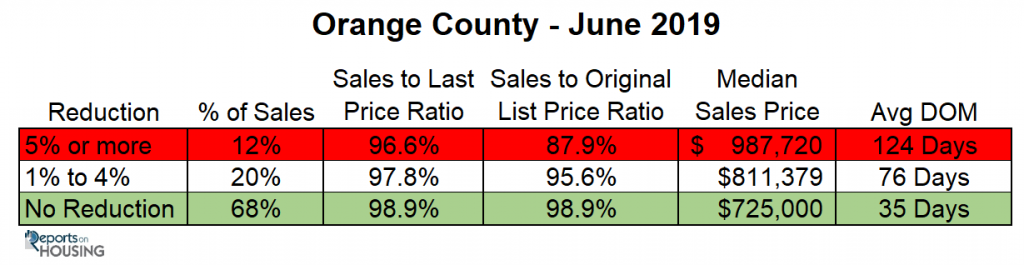
  • There were 2,871 closed residential resales in July, 5% more than July 2018’s 2,734 closed sales. July marked a 6% increase compared to June 2019. The sales to list price ratio was 98.3% for all of Orange County. Foreclosures accounted for just 0.5% of all closed sales, and short sales accounted for 0.24%. That means that 99.3% of all sales were good ol’ fashioned sellers with equity.

Have a great weekend,

Compliments of ….
Roy Hernandez
TNG Real Estate Real Estate Consultants
Cell 949.922.3947

Article courtesy of Steven Thomas and Quantitative Economics and Decision Sciences

Filed Under: orange county real estate news Tagged With: placentia houses for sale, yorba linda houses for sale

OC Housing Report- Golden Opportunity

July 3, 2019 By Roy Hernandez Leave a Comment

Hello!

Accurately pricing a home initially to avoid price reductions is the most lucrative strategy.

Initial Pricing: Sellers who price their homes accurately and avoid price reductions sell their homes for more.

After their own personal pre-race ritual, the sprinters approach their designated starting blocks. The starter raises the pistol into the air stating, “On your mark.” The runners carefully place their track spikes onto their blocks. After everybody looks ready, the starter then utters, “Set.” The athletes get in the loaded position and their legs are ready to fire. Finally, the gun goes off and they explode onto the track. Ultimately, somebody does not have a good start. Some delay. Others do not have the proper form. The initial start is crucial and is an advantage that often propels the athlete with the best start across the finish line with arms raised high in the air.

Similarly, when a home initially comes on the market, the price will determine whether or not a seller will be raising their arms in the air with delight as they successfully close escrow. Buyers today do not want to pay much more than the most recent closed sale. Prices are a lot stickier. The days of rapid appreciation are now in the rearview mirror. Overpriced homes sit without success. Throwing a price out there just to test the market is not a wise strategy. Instead, carefully and methodically pricing a home is vital to cashing in on the Golden Opportunity, the first few weeks after coming on the market.

It is very telling to look at the sales price to last list price ratio. This refers to the final list price prior to opening escrow. In Orange County, 68% of all closed sales in June did not reduce the asking price at all. The sales price to last list price ratio for these homes was 98.9%, meaning, on average, a home sold within 1.1% of the asking price. A home listed at $600,000 sold for $593,400. In addition, 20% of all closed sales reduced their asking prices between 1% and 4%. The sales to list price ratio for these homes was 97.8%. A home listed at $600,000 sold for $586,800. For homes that reduced their asking prices by 5% or more, 12% of closed sales in June, the sales to list price ratio was 96.6%. A home listed at $600,000 sold for $579,600. Everybody would agree that closing for $593,400 is a lot better than $579,600.

The data is staggering in looking at the sales price to original list price. This is the price when a home initially comes on the market prior to any price reductions. For homes that reduced the asking price between 1% to 4%, the sales to original list price ratio was 95.6%. A home that was listed originally for $614,000 had to reduce the asking price to $600,000 to find success. Homes that reduced the asking price by at least 5% had a sales to original list price ratio of 84.1%. A home that was originally listed at $659,000 had to reduce the asking price, often more than once, to $600,000 to find success.

Accurately pricing is critical in obtaining the highest and best sales price. Homes that do not have to reduce ultimately sell for more. The amount of market time increases substantially for those that must reduce. And, there are a lot of price reductions occurring every week right now. An eye-opening 11% of all active listings reduced their asking prices last week.

What is so important about the initial few weeks after coming on the market that helps drive success? There are many buyers who have not yet isolated their home and they are literally waiting on the sidelines for something to come on the market that meets their criteria. Every time a home is fresh to the market, there is a flood of initial activity as potential buyers clamor to be one of the first to take a look. There is more activity in the initial two weeks in entering the fray than any other time when a home is marketed. With the Internet, this period is even more important. Most buyers subscribe to a service that allows them to search homes that are on the market. When a home is newly listed, buyers receive email notifications and they are at the top of the list of homes available that match the buyer’s criteria.

With all of the fanfare, it is not a coincidence that the initial listing period is extremely important. Cashing in on the excitement makes a lot of sense; however, many sellers do not understand the significance and waste this GOLDEN OPPORTUNITY. Yes, a seller can always reduce the asking price down the road to be more in line with a home’s Fair Market Value, but the reduction will not be met with the same enthusiasm as the initial first few weeks. There is not as much excitement surrounding a price reduction. When something is brand new to the market, that is exciting. When something has been exposed to the market for a while, it becomes a bit “shop worn” and loses some of its marketing luster.

The bottom line for sellers: spend more time carefully arriving at the asking price, taking into consideration all the pluses and minuses in the home: condition, upgrades, and location. Having the right price to begin with will not only reduce market time, it will result in more activity and a higher sales price.

Active Inventory: The current active inventory increased by 1% in the past two weeks.

In the past two weeks, the active listing inventory increased by only 107 homes, up 1%, and now totals 7,600. As is normal for this time of the year, the active listing inventory continues to grow week after week. This will continue until it reaches a peak most likely in August.  

Last year at this time there were 6,362 homes on the market. That means that there are 19% more homes available today. This continues to be the highest level of homes on the market for this time of the year since 2011.

Demand: In the past four weeks, demand dropped significantly by 4%. 

Demand, the number of new pending sales over the prior month, dropped by 113 pending sales in the past four weeks, down 4%, and now totals 2,548. It is very telling that demand remains subdued, like last year. However, last year it was due to higher prices coupled with rising rates. Mortgage rates have dropped to levels not seen since September 2016, but even with lower rates, demand remains subdued. This development is a strong indicator that the current housing cycle is nearing its peak. This will develop more in time.

From here, demand will continue to slowly drop through the Summer Market. Once the kids go back to school at the end of August, housing will transition to the Autumn Market and demand will downshift further.

Last year at this time, there were 56 more pending sales, 2% more than today. Two years ago, it was 13% stronger than today.

The current Expected Market Time increased from 84 days to 89 days in the past two weeks, a slight Seller’s Market. It is knocking on the door of a Balanced Market (90 to 120 days), one that does not favor sellers or buyers. Last year, the Expected Market Time was at 73 days, much better than today.

Luxury End:  The luxury market slowed significantly the past couple of weeks.

In the past two-weeks, demand for homes above $1.25 million decreased by 54 pending sales, a 13% drop, and now totals 352, its lowest level since the end of March. The luxury home inventory grew by 27 homes and now totals 2,549, a 1% increase and the highest level of the year. The overall expected market time for homes priced above $1.25 million increased from 186 days to 217 over the past two-weeks, extremely sluggish.

Year over year, luxury demand is down by 11 pending sales, or 3%, and the active luxury listing inventory is up by an additional 375 homes, or 17%. Extra seller competition and continued muted demand, similar to the rest of the Orange County market, is a trend that will persist for the remainder of the year. The expected market time last year was at 180 days, better than today.

For homes priced between $1.25 million and $1.5 million, in the past two-weeks, the Expected Market Time increased from 107 to 118 days. For homes priced between $1.5 million and $2 million, the Expected Market Time increased from 149 to 192 days. For homes priced between $2 million and $4 million, the Expected Market Time decreased from 254 to 250 days. For homes priced above $4 million, the Expected Market Time increased from 441 to 667 days. At 667 days, a seller would be looking at placing their home into escrow around the end of April 2021.

Orange County Housing Market Summary:

  • The active listing inventory increased by 107 homes in the past two weeks, up 1%, and now totals 7,600, the highest level since September 2014. Last year, there were 6,362 homes on the market, 1,238 fewer than today. There are 19% more homes than last year.
  • Demand, the number of pending sales over the prior month, decreased by 113 pending sales in the past two-weeks, down 4%, and now totals 2,548. Last year, there were 2,604 pending sales, 2% more than today.
  • The Expected Market Time for all of Orange County increased from 84 days two weeks ago to 89 days today, a slight Seller’s Market (between 60 to 90 days) and the highest level for this time of the year since 2011. It was at 73 days last year.
  • For homes priced below $750,000, the market is a slight Seller’s Market (between 60 and 90 days) with an expected market time of 64 days. This range represents 39% of the active inventory and 55% of demand.
  • For homes priced between $750,000 and $1 million, the expected market time is 74 days, a slight Seller’s Market. This range represents 18% of the active inventory and 22% of demand.
  • For homes priced between $1 million to $1.25 million, the expected market time is 86 days, a slight Seller’s Market.
  • For luxury homes priced between $1.25 million and $1.5 million, in the past two weeks, the Expected Market Time increased from 118 to 137 days. For homes priced between $1.5 million and $2 million, the Expected Market Time increased from 149 to 192 days. For luxury homes priced between $2 million and $4 million, the Expected Market Time decreased from 254 to 250 days. For luxury homes priced above $4 million, the Expected Market Time increased from 441 to 667 days.
  • The luxury end, all homes above $1.25 million, accounts for 34% of the inventory and only 14% of demand.
  • Distressed homes, both short sales and foreclosures combined, made up only 0.7% of all listings and 1.4% of demand. There are only 22 foreclosures and 33 short sales available to purchase today in all of Orange County, 55 total distressed homes on the active market, up two the last two-weeks. Last year there were 58 total distressed homes on the market, nearly identical to today.
  • There were 2,929 closed residential resales in May, 2% more than May 2018’s 2,870 closed sales. April marked a 15% increase from April 2019. The sales to list price ratio was 97.6% for all of Orange County. Foreclosures accounted for just 0.8% of all closed sales, and short sales accounted for 0.6%. That means that 98.6% of all sales were good ol’ fashioned sellers with equity.

Pictures and article courtesy of Steven Thomas Quantitative Economics and Decision Sciences

Happy 4th of July!
Roy Hernandez
Your Trusted Partner in Real Estate
TNG Real Estate Consultants
949-922-3947

Filed Under: orange county real estate news Tagged With: placentia houses for sale, yorba linda houses for sale

OC Housing Report- Last Call

June 28, 2019 By Roy Hernandez Leave a Comment

Hello!

There is not a lot of steam left in the best time of the year to sell a home and get it under contract. There is not a lot of steam left in the best time of theyear to sell a home and get it under contract.

Last Call: In order for sellers to cash in on the most lucrative time to sell a home during the year, they better open up escrow soon.It is that time of the year for the family vacation. That includes airports, long lines at the TSA checkpoint, connections, and a bit of stress and anxiety. Inevitably, countless travelers with kids in tow will find themselves running to their connecting flight. The sense of urgency is intense. As if to mock the situation, the flight crew announces, “LAST CALL for flight 93!” Frantically many will barely make it, gasping for air while boarding the plane. Still others will arrive at the gate only to find that the “cabin door has been closed.”

It is that time of the year for the family vacation. That includes airports, long lines at the TSA checkpoint, connections, and a bit of stress and anxiety. Inevitably, countless travelers with kids in tow will find themselves running to their connecting flight. The sense of urgency is intense. As if to mock the situation, the flight crew announces, “LAST CALL for flight 93!” Frantically many will barely make it, gasping for air while boarding the plane. Still others will arrive at the gate only to find that the “cabin door has been closed.”

This is also the time of year when many sellers come on the market thinking they have an ample amount of time to market their home to take advantage of the Summer Market, but that simply is not the case. Yes, summer has just begun, but the Summer Market for housing already started in May. The housing market shifts from away from the Spring Market with the distractions of the end of the school year, especially graduations. From there, the distractions of summer and the family activities take hold: family vacations, trips to the beach, trips to the pool, family reunions, summer camps, and picnics. Life gets in the way for many that are looking to purchase a home. As a result, housing downshifts from the best time of the year to sell, the spring, to the second-best time of the year, summer.

Right around the corner is the Autumn Market. For housing, that begins as soon as the kids go back to school, which is the end of August. As soon as school starts, it is no longer the most advantageous time of the year to move a family. As a result, many buyers put searching for a home on hold until the following year. Once school starts, it is just too disruptive for a family move. Changing schools is out of the question for too many families; it is just too disruptive. So, buyers want to close escrow by the end of August. Most escrow are between 30 to 45 days, meaning they need to open escrow by the end of July.

For sellers to take advantage of the second-best time of the year to sell, they need to open escrow by July 31st, six weeks from now. Pricing a home correctly is absolutely fundamental to cash in on the housing market and find success. This year, similar to 2018, the market is a bit different compared to what everybody has heard. The ultra-hot Southern California housing market with rapid appreciation, zillions of offers, and only days on the market before opening escrow are in the rearview mirror. That was the housing markets of 2012 through 2017.

Orange County housing today is characterized by a bit more inventory, 23% more than last year, and muted demand, 20% less than 2012 through 2017. The local housing market feels a lot more sluggish. Sellers need to keep in mind that they are still fetching record prices, but they cannot get away with stretching their asking price like prior years. For the sellers that overprice, even slightly, expect to sit on the market with less activity and no offers.

Many sellers enter the housing fray in July, thinking they have plenty of time to cash in on the Summer Market. What they do not understand is that they need to close escrow by August 31st. They have an extremely limited amount of time to isolate a buyer, negotiate the sell, and then open escrow. They are down to a few short weeks. For those sellers that are late to the housing party, they certainly better be priced right on the money. Starting off overpriced means that they will have to reduce their asking price to be successful. That reduction may come too late, mid-August. That’s when demand is already dropping and so are their chances of achieving their goal in selling.

LAST CALL to take advantage of the second-best time of the year to sell a home!!

Active Inventory: The current active inventory is unchanged in the past two weeks. In the past two weeks, the active listing inventory increased by only 14 homes, nearly unchanged, and now totals 7,493. Typically, this is the time of the year when the active listing inventory is rising until peaking sometime between July and August; however, within the past four-weeks, 7% fewer homes have come on the market compared to last year. Only time will tell if that is just an anomaly or a developing trend.

Last year at this time there were 6,105 homes on the market. That means that there are 23% more homes available today. This is the highest level of homes on the market for this time of the year since 2011.

Demand: In the past four weeks, demand grew by 1%.  Demand, the number of new pending sales over the prior month, increased by 15 pending sales in the past four weeks, up 1%, and now totals 2,661. Muted demand was the theme last year and it continues to be the theme in 2019. Demand will slowly drop from here, which will pick up steam in September during the Autumn Market.

Last year at this time, there were 38 more pending sales, 1% more than today. Two years ago, it was 10% stronger than today.

The current Expected Market Time decreased from 85 days to 84 days in the past two weeks, a slight Seller’s Market. It is still the highest reading for this time of the year since 2011. Last year, the Expected Market Time was at 68 days, better than today.

Luxury End:  The luxury market improved slightly in the past couple of weeks. In the past two-weeks, demand for homes above $1.25 million increased by 17 pending sales, a 4% increase, and now totals 406, the second highest level for 2019 compared to mid-April’s 424. The luxury home inventory grew by 14 homes and now totals 2,522, a 1% increase and the highest level of the year. The overall expected market time for homes priced above $1.25 million decreased from 193 days to 186 over the past two-weeks, a slight drop, but still quite sluggish.

Year over year, luxury demand is up by 17 pending sales, or 4%, and the active luxury listing inventory is up by an additional 357 homes, or 16%. Extra seller competition and muted demand in the luxury ranges in 2019 is a trend that has endured. The expected market time last year was at 167 days, a bit better than today.

For homes priced between $1.25 million and $1.5 million, in the past two-weeks, the Expected Market Time increased from 107 to 118 days. For homes priced between $1.5 million and $2 million, the Expected Market Time decreased from 167 to 149 days. For homes priced between $2 million and $4 million, the Expected Market Time decreased from 302 to 254 days. For homes priced above $4 million, the Expected Market Time increased from 419 to 441 days. At 441 days, a seller would be looking at placing their home into escrow around the end of August 2020.

Orange County Housing Market Summary:

  • The active listing inventory increased by 14 homes in the past two weeks, nearly unchanged, and now totals 7,493, the highest level since September 2014. Last year, there were 6,105 homes on the market, 1,388 fewer than today. There are 23% more homes than last year.
  • Demand, the number of pending sales over the prior month, increased by 15 pending sales in the past two-weeks, up 1%, and now totals 2,661. Last year, there were 2,699 pending sales, 1% more than today.
  • The Expected Market Time for all of Orange County decreased from 85 days two weeks ago to 84 days today, a slight Seller’s Market (between 60 to 90 days) and the highest level for this time of the year since 2011. It was at 68 days last year.
  • For homes priced below $750,000, the market is a slight Seller’s Market (between 60 and 90 days) with an expected market time of 61 days. This range represents 39% of the active inventory and 54% of demand.
  • For homes priced between $750,000 and $1 million, the expected market time is 70 days, a slight Seller’s Market. This range represents 18% of the active inventory and 22% of demand.
  • For homes priced between $1 million to $1.25 million, the expected market time is 92 days, a Balanced Market.
  • For luxury homes priced between $1.25 million and $1.5 million, in the past two weeks, the Expected Market Time increased from 107 to 118 days. For homes priced between $1.5 million and $2 million, the Expected Market Time decreased from 167 to 149 days. For luxury homes priced between $2 million and $4 million, the Expected Market Time decreased from 302 to 254 days. For luxury homes priced above $4 million, the Expected Market Time increased from 419 to 441 days.
  • The luxury end, all homes above $1.25 million, accounts for 34% of the inventory and only 16% of demand.
  • Distressed homes, both short sales and foreclosures combined, made up only 0.7% of all listings and 1.4% of demand. There are only 21 foreclosures and 32 short sales available to purchase today in all of Orange County, 53 total distressed homes on the active market, down 12 in the last two-weeks. Last year there were 50 total distressed homes on the market, nearly identical to today.
  • There were 2,929 closed residential resales in May, 2% more than May 2018’s 2,870 closed sales. April marked a 15% increase from April 2019. The sales to list price ratio was 97.6% for all of Orange County. Foreclosures accounted for just 0.8% of all closed sales, and short sales accounted for 0.6%. That means that 98.6% of all sales were good ol’ fashioned sellers with equity.

Article and pictures courtesy of Steven Thomas, Quantitative Economics and Decision Sciences

Have a great week.

Sincerely,

Roy Hernandez

Your Trusted Partner In Real Estate

Cell 949.922.3947

Filed Under: orange county real estate news Tagged With: placentia houses for sale, yorba linda houses for sale

RoyaltyAgent@gmail.com

Search All Houses FOR SALE

Hot Bank Foreclosures & REO

Current Mortgage Rates

[mlrates state="CA" size="narrow"]

Fullerton Homes FOR SALE by Price

$300,000- $500,000
$500,000- $700,000
$700,000- $900,000
$900,000- $1,100,000
$1,100,000 and above

Fullerton Condos FOR SALE by Price

$200,000- $300,000
$300,00- $400,000
$400,000 and above

Our Coverage Areas

Brea Homes FOR SALE

Brea North Hills FOR SALE

Whittier Homes FOR SALE

Fullerton Homes FOR SALE

Placentia Homes FOR SALE

La Habra Homes FOR SALE

Yorba Linda Homes FOR SALE

Anaheim Homes FOR SALE

Brea Special Events

Community Reports

downtown brea

City Information


Brea

Yorba Linda

Placentia

Fullerton

La Habra

Tag Cloud

Anaheim Hills real estate for sale Anaheim house for sale bank owned Brea bank owned for sale Brea community info Brea foreclosure for sale Brea house for sale Brea houses for sale Brea real estate Brea real estate for sale Brea REO Brea REO for sale buyer real estate news foreclosure for sale Fullerton house FOR SALE Fullerton houses for sale Fullerton real estate Fullerton Real Estate For Sale fullerton resort living housing data housing market housing news la habra houses for sale La Habra real estate for sale north orange county for sale north orange county real estate orange county housing info orange county real estate Orange county real estate for sale orange county shadow inventory placentia condos for sale placentia for sale placentia homes for sale placentia houses for sale placentia real estate real estate information real estate news orange county REO for sale REO property for sale seller information whittier houses for sale Yorba Linda for sale Yorba Linda homes for sale yorba linda houses for sale Yorba Linda real estate for sale
The Virtual Realty Group
Roy Hernandez
cell/text (949) 922-3947
RoyaltyAgent @ gmail.com
RoyalAgent.net
BRE#01202958
  • Blog Page
  • I’d like to sell my house
  • About

Copyright © 2025 Website by The Burrell Group · Log in