Hello!
Accurately pricing a home initially to avoid price reductions is the most lucrative strategy.
Initial Pricing: Sellers who price their homes accurately and avoid price reductions sell their homes for more.
After their own personal pre-race ritual, the sprinters approach their designated starting blocks. The starter raises the pistol into the air stating, “On your mark.” The runners carefully place their track spikes onto their blocks. After everybody looks ready, the starter then utters, “Set.” The athletes get in the loaded position and their legs are ready to fire. Finally, the gun goes off and they explode onto the track. Ultimately, somebody does not have a good start. Some delay. Others do not have the proper form. The initial start is crucial and is an advantage that often propels the athlete with the best start across the finish line with arms raised high in the air.
Similarly, when a home initially comes on the market, the price will determine whether or not a seller will be raising their arms in the air with delight as they successfully close escrow. Buyers today do not want to pay much more than the most recent closed sale. Prices are a lot stickier. The days of rapid appreciation are now in the rearview mirror. Overpriced homes sit without success. Throwing a price out there just to test the market is not a wise strategy. Instead, carefully and methodically pricing a home is vital to cashing in on the Golden Opportunity, the first few weeks after coming on the market.
It is very telling to look at the sales price to last list price ratio. This refers to the final list price prior to opening escrow. In Orange County, 68% of all closed sales in June did not reduce the asking price at all. The sales price to last list price ratio for these homes was 98.9%, meaning, on average, a home sold within 1.1% of the asking price. A home listed at $600,000 sold for $593,400. In addition, 20% of all closed sales reduced their asking prices between 1% and 4%. The sales to list price ratio for these homes was 97.8%. A home listed at $600,000 sold for $586,800. For homes that reduced their asking prices by 5% or more, 12% of closed sales in June, the sales to list price ratio was 96.6%. A home listed at $600,000 sold for $579,600. Everybody would agree that closing for $593,400 is a lot better than $579,600.

The data is staggering in looking at the sales price to original list price. This is the price when a home initially comes on the market prior to any price reductions. For homes that reduced the asking price between 1% to 4%, the sales to original list price ratio was 95.6%. A home that was listed originally for $614,000 had to reduce the asking price to $600,000 to find success. Homes that reduced the asking price by at least 5% had a sales to original list price ratio of 84.1%. A home that was originally listed at $659,000 had to reduce the asking price, often more than once, to $600,000 to find success.
Accurately pricing is critical in obtaining the highest and best sales price. Homes that do not have to reduce ultimately sell for more. The amount of market time increases substantially for those that must reduce. And, there are a lot of price reductions occurring every week right now. An eye-opening 11% of all active listings reduced their asking prices last week.
What is so important about the initial few weeks after coming on the market that helps drive success? There are many buyers who have not yet isolated their home and they are literally waiting on the sidelines for something to come on the market that meets their criteria. Every time a home is fresh to the market, there is a flood of initial activity as potential buyers clamor to be one of the first to take a look. There is more activity in the initial two weeks in entering the fray than any other time when a home is marketed. With the Internet, this period is even more important. Most buyers subscribe to a service that allows them to search homes that are on the market. When a home is newly listed, buyers receive email notifications and they are at the top of the list of homes available that match the buyer’s criteria.
With all of the fanfare, it is not a coincidence that the initial listing period is extremely important. Cashing in on the excitement makes a lot of sense; however, many sellers do not understand the significance and waste this GOLDEN OPPORTUNITY. Yes, a seller can always reduce the asking price down the road to be more in line with a home’s Fair Market Value, but the reduction will not be met with the same enthusiasm as the initial first few weeks. There is not as much excitement surrounding a price reduction. When something is brand new to the market, that is exciting. When something has been exposed to the market for a while, it becomes a bit “shop worn” and loses some of its marketing luster.
The bottom line for sellers: spend more time carefully arriving at the asking price, taking into consideration all the pluses and minuses in the home: condition, upgrades, and location. Having the right price to begin with will not only reduce market time, it will result in more activity and a higher sales price.
Active Inventory: The current active inventory increased by 1% in the past two weeks.
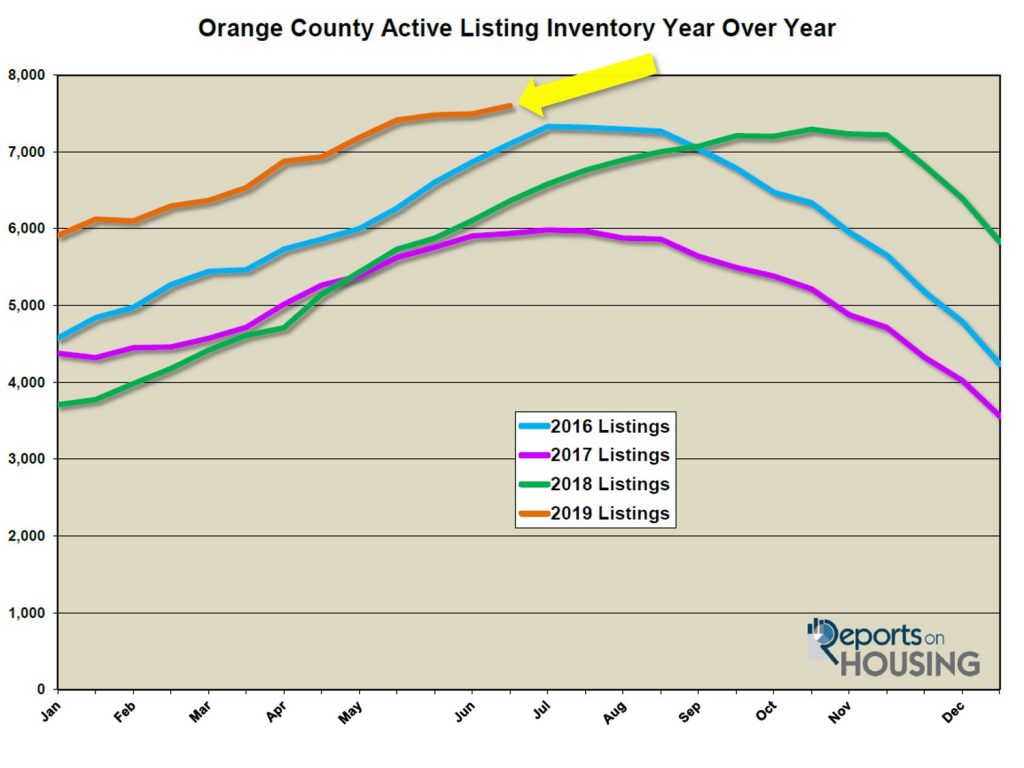
In the past two weeks, the active listing inventory increased by only 107 homes, up 1%, and now totals 7,600. As is normal for this time of the year, the active listing inventory continues to grow week after week. This will continue until it reaches a peak most likely in August.
Last year at this time there were 6,362 homes on the market. That means that there are 19% more homes available today. This continues to be the highest level of homes on the market for this time of the year since 2011.

Demand: In the past four weeks, demand dropped significantly by 4%.
Demand, the number of new pending sales over the prior month, dropped by 113 pending sales in the past four weeks, down 4%, and now totals 2,548. It is very telling that demand remains subdued, like last year. However, last year it was due to higher prices coupled with rising rates. Mortgage rates have dropped to levels not seen since September 2016, but even with lower rates, demand remains subdued. This development is a strong indicator that the current housing cycle is nearing its peak. This will develop more in time.
From here, demand will continue to slowly drop through the Summer Market. Once the kids go back to school at the end of August, housing will transition to the Autumn Market and demand will downshift further.
Last year at this time, there were 56 more pending sales, 2% more than today. Two years ago, it was 13% stronger than today.
The current Expected Market Time increased from 84 days to 89 days in the past two weeks, a slight Seller’s Market. It is knocking on the door of a Balanced Market (90 to 120 days), one that does not favor sellers or buyers. Last year, the Expected Market Time was at 73 days, much better than today.
Luxury End: The luxury market slowed significantly the past couple of weeks.
In the past two-weeks, demand for homes above $1.25 million decreased by 54 pending sales, a 13% drop, and now totals 352, its lowest level since the end of March. The luxury home inventory grew by 27 homes and now totals 2,549, a 1% increase and the highest level of the year. The overall expected market time for homes priced above $1.25 million increased from 186 days to 217 over the past two-weeks, extremely sluggish.
Year over year, luxury demand is down by 11 pending sales, or 3%, and the active luxury listing inventory is up by an additional 375 homes, or 17%. Extra seller competition and continued muted demand, similar to the rest of the Orange County market, is a trend that will persist for the remainder of the year. The expected market time last year was at 180 days, better than today.
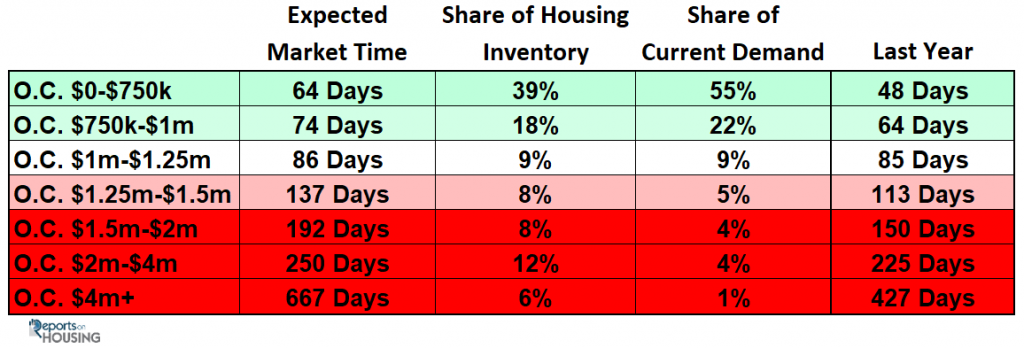
For homes priced between $1.25 million and $1.5 million, in the past two-weeks, the Expected Market Time increased from 107 to 118 days. For homes priced between $1.5 million and $2 million, the Expected Market Time increased from 149 to 192 days. For homes priced between $2 million and $4 million, the Expected Market Time decreased from 254 to 250 days. For homes priced above $4 million, the Expected Market Time increased from 441 to 667 days. At 667 days, a seller would be looking at placing their home into escrow around the end of April 2021.

Orange County Housing Market Summary:
- The active listing inventory increased by 107 homes in the past two weeks, up 1%, and now totals 7,600, the highest level since September 2014. Last year, there were 6,362 homes on the market, 1,238 fewer than today. There are 19% more homes than last year.
- Demand, the number of pending sales over the prior month, decreased by 113 pending sales in the past two-weeks, down 4%, and now totals 2,548. Last year, there were 2,604 pending sales, 2% more than today.
- The Expected Market Time for all of Orange County increased from 84 days two weeks ago to 89 days today, a slight Seller’s Market (between 60 to 90 days) and the highest level for this time of the year since 2011. It was at 73 days last year.
- For homes priced below $750,000, the market is a slight Seller’s Market (between 60 and 90 days) with an expected market time of 64 days. This range represents 39% of the active inventory and 55% of demand.
- For homes priced between $750,000 and $1 million, the expected market time is 74 days, a slight Seller’s Market. This range represents 18% of the active inventory and 22% of demand.
- For homes priced between $1 million to $1.25 million, the expected market time is 86 days, a slight Seller’s Market.
- For luxury homes priced between $1.25 million and $1.5 million, in the past two weeks, the Expected Market Time increased from 118 to 137 days. For homes priced between $1.5 million and $2 million, the Expected Market Time increased from 149 to 192 days. For luxury homes priced between $2 million and $4 million, the Expected Market Time decreased from 254 to 250 days. For luxury homes priced above $4 million, the Expected Market Time increased from 441 to 667 days.
- The luxury end, all homes above $1.25 million, accounts for 34% of the inventory and only 14% of demand.
- Distressed homes, both short sales and foreclosures combined, made up only 0.7% of all listings and 1.4% of demand. There are only 22 foreclosures and 33 short sales available to purchase today in all of Orange County, 55 total distressed homes on the active market, up two the last two-weeks. Last year there were 58 total distressed homes on the market, nearly identical to today.
- There were 2,929 closed residential resales in May, 2% more than May 2018’s 2,870 closed sales. April marked a 15% increase from April 2019. The sales to list price ratio was 97.6% for all of Orange County. Foreclosures accounted for just 0.8% of all closed sales, and short sales accounted for 0.6%. That means that 98.6% of all sales were good ol’ fashioned sellers with equity.
Pictures and article courtesy of Steven Thomas Quantitative Economics and Decision Sciences
Happy 4th of July!
Roy Hernandez
Your Trusted Partner in Real Estate
TNG Real Estate Consultants
949-922-3947


Leave a Reply