 The 2016 Orange County housing market has been incredibly hot, yet there are plenty of unsuccessful sellers.
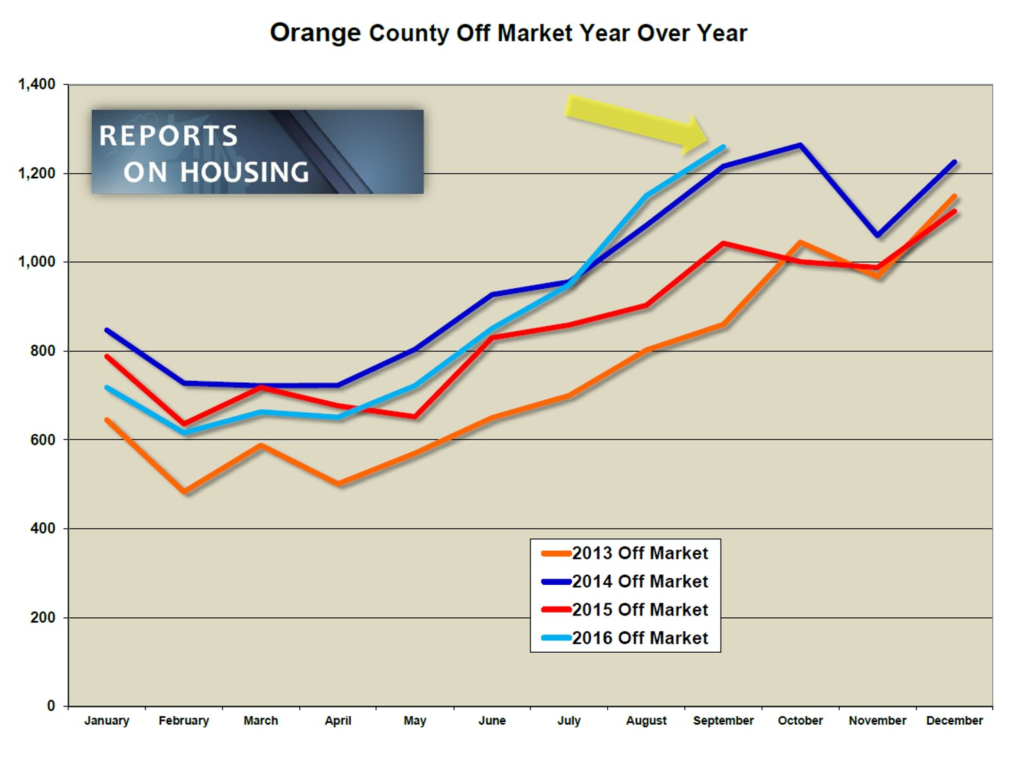
Unsuccessful Sellers: There are 7% more homes pulled off the market this year compared to 2015.
The housing market has been HOT this year. As a matter of fact, current demand is up 13% year over year. The inventory has been way below the long term average, homes have flown off the market, multiple offers are still the norm, and homes are fetching values very close to their asking prices. Yet, through September, there were still 7,577 sellers who were not successful and pulled their homes off the market, 7% more than last year.
What gives? If the market is blazing hot, why in the world wouldn’t every seller be successful? There are many reasons why homes don’t sell, even in an environment where supply is low and demand is high; but, the number one reason boils down to over exuberant sellers. Buyers are just not that willing to stretch too far above the most recent comparable sale.
 This is not just a luxury market phenomenon. 48% of all homes pulled off the market could be found below $750,000, and 66% were below $1 million. There were plenty of unsuccessful sellers in the hottest ranges. Even the sizzling hot price range below $500,000, where the expected market time has been less than 2 months all year long, experienced a lack of success. 1,667 sellers pulled their homes off the market in this range, or 22% of all unsuccessful sellers.
Price is the biggest bellwether in successfully selling a home. Many homeowners come on the market feeling that their home is the absolute best in the neighborhood, and, therefore, should fetch the highest sales price, more than the most recent comparable sale. This leads to stretching the price too high and pushes away buyers from writing an offer.
A brilliant strategy is to price a home very close to the most recent comparable or pending sale. Typically, this approach results in multiple offers. Multiple offers can be leveraged to procure negotiated prices above the asking price. Another strategy is to offer a little less than the last comparable or pending sale, leading to even more offers to purchase. This approach quickly can turn into a bidding war for a home and often results in negotiated prices way above the asking price.
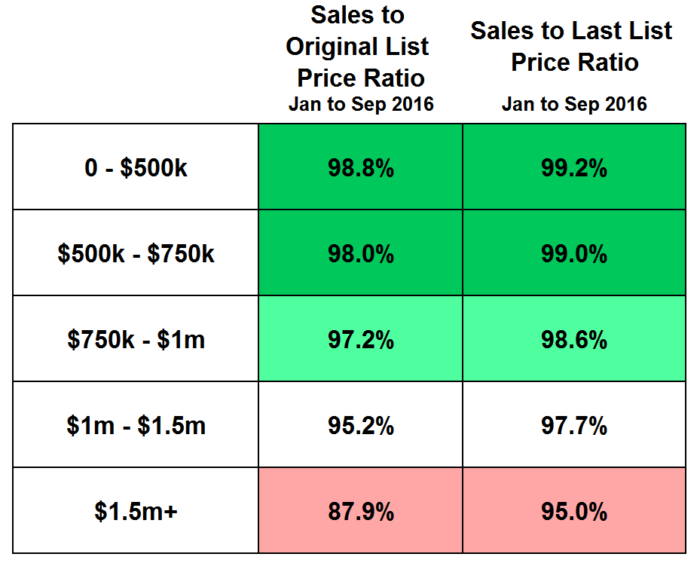
Instead, most sellers initially opt to overprice their home. In tracking the sales to list price ratio, sellers are fetching values very close to their asking prices. But, if you look at the Sales to the Original List Price Ratio and compare it to the Sales to Last List Price Ratio, the higher the price, the more a home had to reduce the price in order to find success. For example, a home originally priced at $850,000, on average, had to reduce the price to $838,000, ultimately selling for $826,000.
Sellers take a look at the most recent comparable pending and closed sales and then justify a higher asking price for their home. They want a little extra cushion for negotiations. They also feel their home is the best in the neighborhood and will bring them a record price. Both result in overpricing and prevent a home from obtaining any offers. Consequently, they will have to reduce the asking price to be in alignment with the Fair Market Value; or, ultimately, they will have to pull their home off the market.
Pricing is essential and homeowners need to lean on the expertise of a professional, their REALTOR®, or they risk wasting their time and energy in preparing and exposing their home to the market for a lengthy period of time.
Luxury End: Luxury demand increased by 9% in the past month.
In the past month, demand for homes above $1 million increased from 417 to 456 pending sales, a 9% increase. During that same time, the luxury home inventory dropped from 2,574 homes to 2,402, a 7% drop. With an increase in demand and a falling inventory, the expected market time dropped from 175 days to 158 days for homes priced above $1 million.
For homes priced between $1 million to $1.5 million, the expected market time decreased from 122 days to 113 in the past two weeks. For homes priced between $1.5 million to $2 million, the expected market time decreases from 168 days to 165 days. For homes priced above $2 million, the expected market time dropped significantly from 306 days to 245 days. It was at 385 days just one month ago. Still, at 245 days, a seller is looking at placing their home in escrow in mid-June 2017.
From $1 million to $2 million, demand (the number of pending sales over the prior month) is up by 18%, 327 pending sales today compared to 276 last year. The inventory is up by 12%, 357 homes compared to 318 in 2015. For luxury homes above $2 million, demand is up by 8%, 103 pending sales compared to 95, a difference of 8. The inventory is up 17%, 1,049 homes today compared to 894 last year, a difference of 155. Even though demand is up a few pending sales, there are a lot more luxury homes on the market competing against each other.
Active Inventory: The active inventory shed 314 in just two weeks, a 5% drop.
In the past couple of weeks, the active inventory dropped by 314 homes, the largest drop so far this year. The 5% drop resulted in reaching levels not seen since mid-May and now totals 6,472. In the past month, the inventory has plunged by 568 homes, or 8%. A drop in the inventory is typical for the Autumn Market, but a 568 home drop in a month is the largest for this time of the year since 2008 when it declined from 13,582 homes to 12,940, or 5%. Keep in mind, there were a lot more homes on the market back then.
Expect the inventory will continue to drop for the remainder of the year. Last year there were 257 more homes on the market, an additional 4%, totaling 6,729.
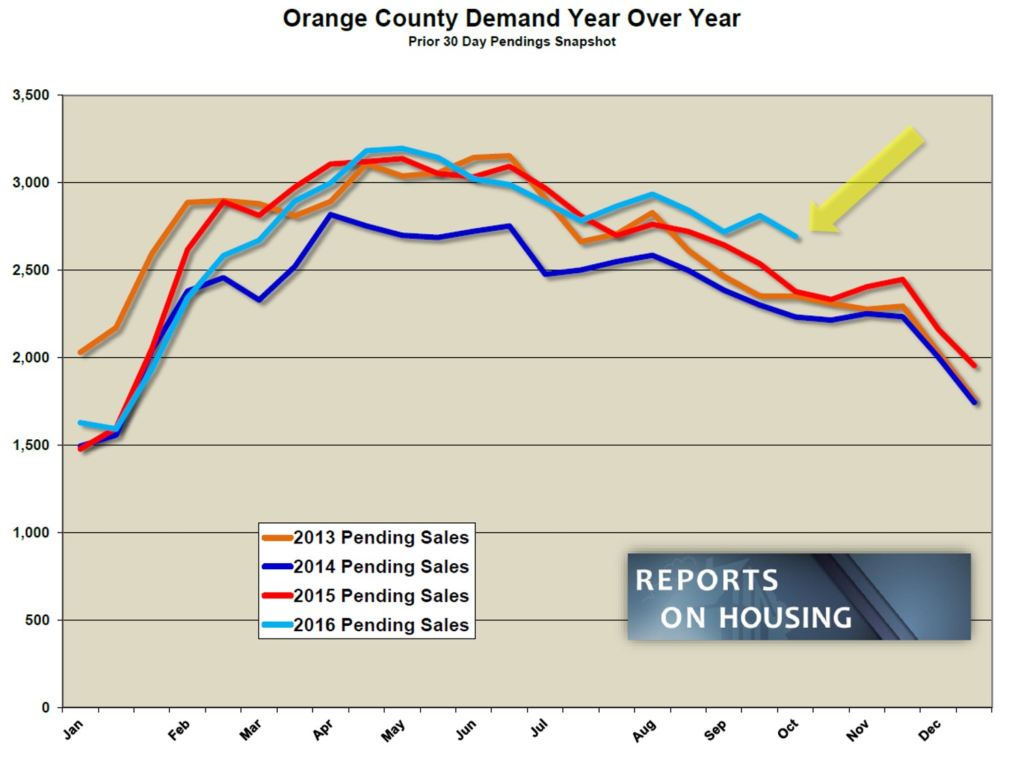
Demand: The market is surging with demand up 13% year over year.
Demand, the number of new pending sales over the prior month, decreased from 2,812 to 2,693, a drop of 119, or 4%. Yet, it is the hottest start to October since 2012. That market was completely different with foreclosures and short sales accounting for 31% of all sales compared to just 3% today.
Demand is considerably stronger than last year at this time, up 13% year over year. There were 315 fewer pending sales last year, totaling 2,378.
With a drop in both demand and the active inventory, the expected market time remained the same at 72 days.

Orange County Housing Market Summary:
• The active listing inventory dramatically dropped in the past couple of weeks, shedding 314 homes, or 5%, and now totals 6,472, the lowest level since mid-May. The inventory will continue to drop through the end of the year.
• There are 21% fewer homes on the market below $500,000 compared to last year at this time and demand is identical to last year. The trend of a disappearing lower range continues with fewer and fewer homes available as home prices continue to rise.
• Demand, the number of pending sales over the prior month, decreased by 4% from 2,812 to 2,693 in the past two weeks. Yet, it is the strongest start to October since 2012. Demand was at 2,378 pending sales last year. Today’s demand is a staggering 13% more than last year. The average pending price is $823,442.
• The average list price for all of Orange County is $1.5 million.
• For homes priced below $750,000, the market is HOT with an expected market time of just 49 days. This range represents 45% of the active inventory and 66% of demand.
• For homes priced between $750,000 and $1 million, the expected market time is 77 days, a slight seller’s market (between 60 and 90 days). This range represents 18% of the active inventory and 17% of demand.
• For luxury homes priced between $1 million to $1.5 million, the expected market time is at 113 days, decreasing by 9 days in the past couple of weeks. For homes priced between $1.5 million to $2 million, the expected market time decreased from 168 days to 165 days. For luxury homes priced above $2 million, the expected market time dropped considerably from 306 days to 245 days.
• The luxury end, all homes above $1 million, accounts for 37% of the inventory and only 17% of demand.
• The expected market time for all homes in Orange County remained the same in the past couple of weeks, 72 days, a slight seller’s market (between 60 and 90 days).
• Distressed homes, both short sales and foreclosures combined, make up only 2% of all listings and 2.7% of demand. There are 38 foreclosures and 90 short sales available to purchase today in all of Orange County, that’s 128 total distressed homes on the active market, increasing by 8 in the past two weeks. Last year there were 185 total distressed sales, 45% more.
• There were 2,745 closed sales in September, a 10% drop from July and up 2% compared to September 2015’s total of 2,680 closings. The sales to list price ratio was 97.9%. Foreclosures accounted for 1.3% of all closed sales and short sales accounted for 1.9%. That means that 96.8% of all sales were good ol’ fashioned equity sellers.
Have a great week.
Sincerely,
Roy Hernandez
TNG Real Estate Consultants
Cell 949.922.3947
[gravityform id=”22″ title=”true” description=”true”]


Leave a Reply