Hello!
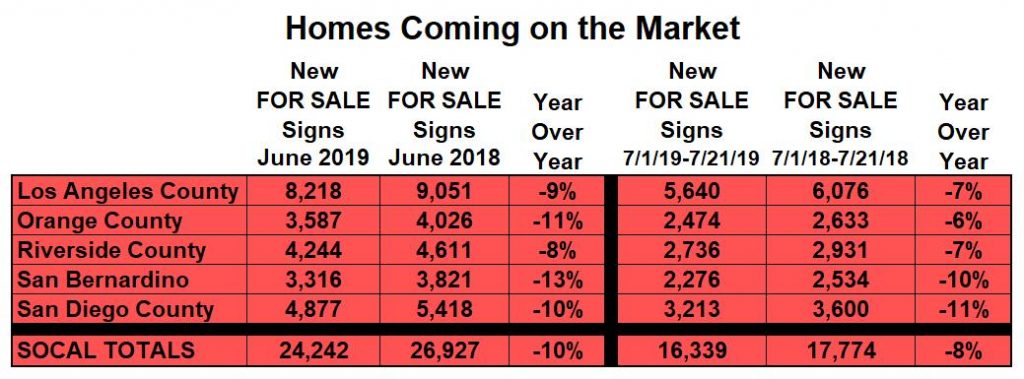
It is the Summer Market yet there are fewer new FOR SALE signs this year.
Fewer Listings: Not as many homeowners are placing their homes on the market than what is typical for this time of the year.
The lazy days of summer are here. Sitting in the back yard under the umbrella drinking a tall cold glass of lemonade, nothing beats it. Time seems to stand still. The pressures of the rat race of life fade for a moment while basking in the warm summer air. It is a welcome break from the fast pace of working so hard.
The summer of 2019 is shaping up to be quite the same way for housing, many homeowners are kicking back in their homes and enjoying the warmer weather rather than placing their homes on the market.
In Orange County, there were 11% fewer homes that came on the market in June of this year compared to June of 2018. That equates to 439 FOR SALE signs. So far in July, there are 6% fewer, or 159 missing FOR SALE signs year-over-year. For buyers monitoring local housing closely, they have witnessed this recent phenomenon. There simply are not as many new homes coming on for buyers to tour.

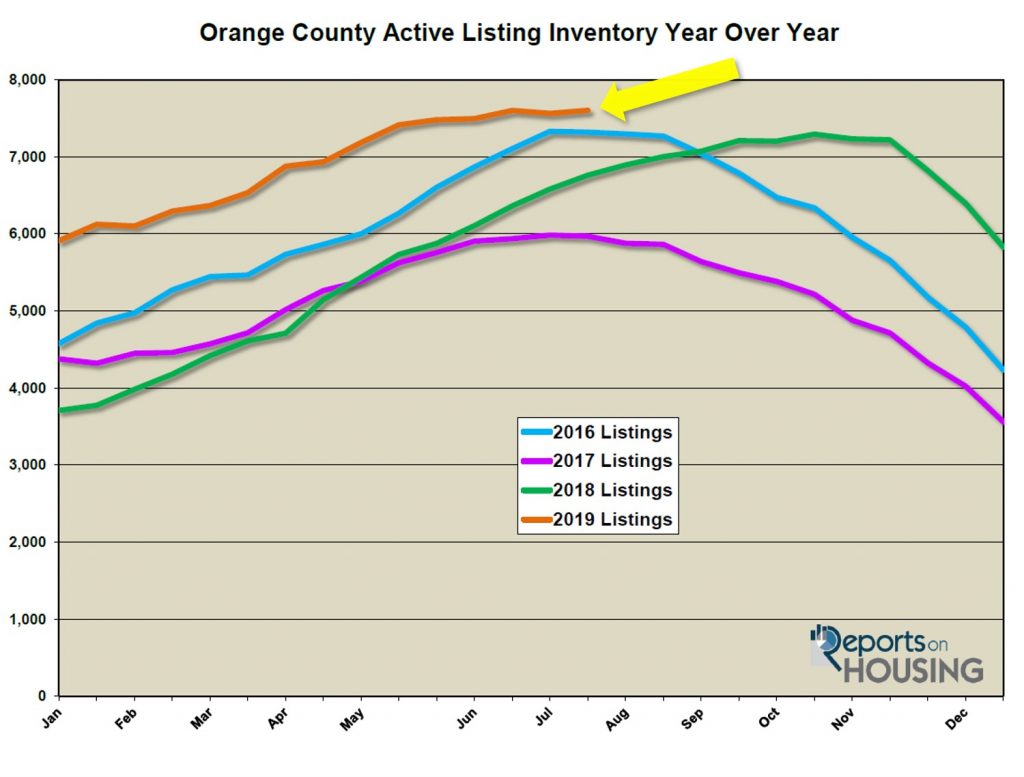
With not as many homes entering the fray, the active listing inventory is not growing as fast as is typical for the Summer Market. In June and July, the inventory has only grown by 122 homes, or 2%. From 2013 through 2018, on average, it has grown by 819 homes, or 15%. The limited number of homes coming on the market this year has had an impact on the overall choices for buyers.
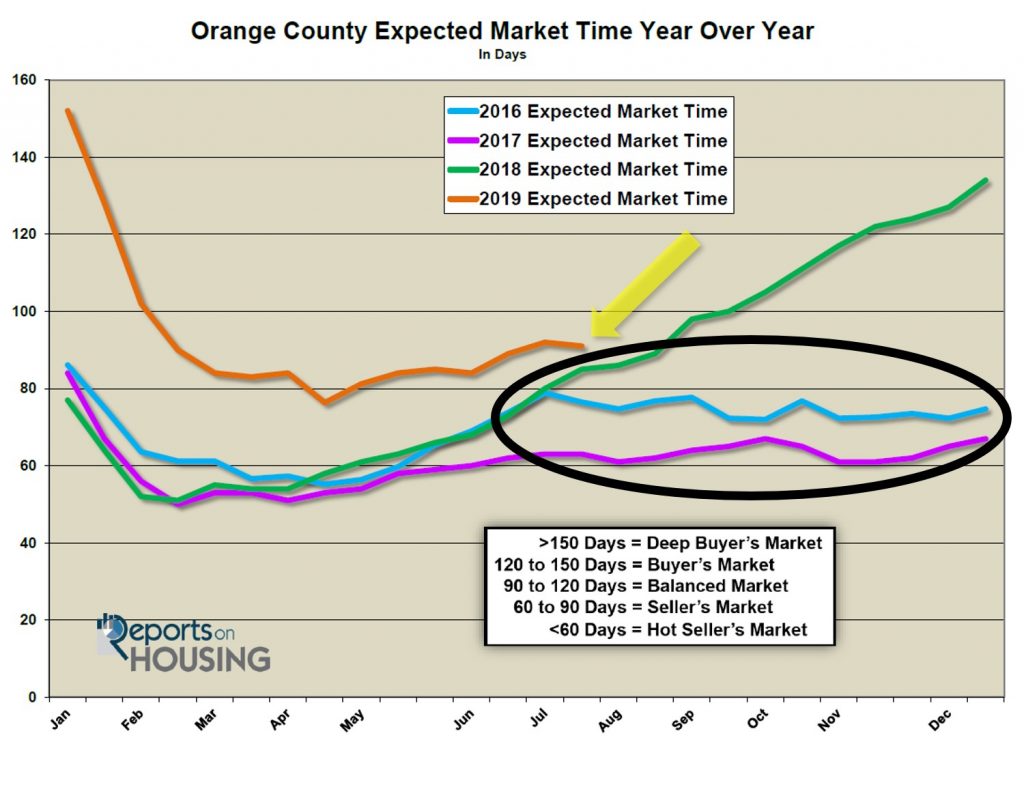
For sellers desiring an even hotter housing market, that is not what is going on here. Instead, the Expected Market Time (the time it would take for a home that comes on the market today to enter escrow down the road) is not slowing as much as it normally does during the summer time. At the end of May, it was at 85 days. Today, it is at 91 days. That is only an increase of 6 days compared to the average from 2013 through 2018 of 15 days. At 91 days, Orange County is experiencing a Balanced Market (from 90 to 120 days), one that does not favor sellers or buyers. Nobody is in the driver’s seat in a market that is balanced, home values do not change, and there are fewer multiple offer situations.
Had the typical number of homes come on the market, it would be a deeper Balanced Market. This is more than just a blip on the housing radar. It is a trend that will ultimately impact the overall feel and trajectory of the market for the remainder of 2019. Fewer FOR SALE signs translates to fewer choices and a stronger Expected Market Time. Summer is a time when demand softens a bit as the supply of homes increases. That continues until housing transitions to the Autumn Market, where the Expected Market Time remains relatively the same for the rest of the year. With the growth in the supply of homes slowing early, it means the Expected Market Time will not change much from the summer through the end of the year. When the kids go back to school, even fewer homes come on the market while buyer demand diminishes. With both supply and demand falling at nearly the same rate, not much changes in the overall feel of housing.

Last year, the big story was a giant drop in demand (the number of pending sales in the last month), especially noticeable from mid-July through the end of the year. The drop in demand was exasperated by rising interest rates, climbing from 4.5% to 5% from July through November. That translated to an increasing Expected Market Time through the end of the year. That is not going to occur this year while interest rates remain at a three-year low, around 3.75%.
Why are there fewer FOR SALE signs popping up in neighborhoods across Southern California? It could be the deluge of negative housing stories swirling across the nation. It could be all the talk of a pending recession. It is anybody’s guess at this point. Collectively, more homeowners are sitting in their back yards, sipping an ice-cold glass of lemonade, and enjoying the summer warmth, instead of coming on the market and participating in the game of real estate.
Active Inventory: The current active inventory increased by 40 homes in the past two-weeks.
In the past two-weeks, the active listing inventory increased by only 40 homes, up 0.5%, and now totals 7,601. That beats the 2019 height reached a month ago by one extra home. This could be the peak for 2019, unless it climbs one more time over the coming two weeks. From there, housing will transition to the Autumn Market. With both the Spring and Summer Markets in the rearview mirror, fewer homeowners place their homes on the market and many unsuccessful sellers throw in the towel and pull their homes off the market. The active listing inventory will drop for the remainder of the year.
Last year at this time there were 6,759 homes on the market. That means that there are 12% more homes available today. This continues to be the highest level of homes on the market for this time of the year since 2011. Soon, there will be fewer homes on the market this year compared to 2018. The inventory will be dropping at a time when it was increasing last year.

Demand: In the past two- weeks, demand increased by 2%.
Demand, the number of new pending sales over the prior month, increased by 44 pending sales in the past two-weeks, up 2%, and now totals 2,505. From here, expect demand to rise slightly over the coming two weeks, a last hurrah for the Summer Market. Then, it will transition into the Autumn Market where demand will methodically fall for the remainder of the year.
Last year at this time, there were 112 fewer pending sales, fewer than today. Current demand is still muted, just not as severe as this time last year when interest rates were climbing. Two years ago, it was 13% stronger than today.
The current Expected Market Time decreased from 92 days to 91 days in the past two weeks, a Balanced Market (90 to 120 days), one that does not favor sellers or buyers. Last year, the Expected Market Time was at 85 days, slightly better than today.
Luxury End: The luxury market slowed considerably in the past couple of weeks.
In the past two-weeks, demand for homes above $1.25 million decreased by 29 pending sales, an 8% drop, and now totals 316, its lowest level since February. The luxury home inventory increased by 29 homes and now totals 2,551, a 1% rise and the highest level of the year. The overall Expected Market Time for homes priced above $1.25 million increased from 219 days to 242 over the past two-weeks, extremely sluggish.
Year over year, luxury demand is up by 3 pending sales, or 1%, and the active luxury listing inventory is up by an additional 359 homes, or 16%. Extra seller competition and continued muted is a trend that will persist for the remainder of the year. The expected market time last year was at 210 days, better than today. For homes priced between $1.25 million and $1.5 million, in the past two-weeks, the Expected Market Time increased from 143 to 147 days. For homes priced between $1.5 million and $2 million, the Expected Market Time increased from 189 to 240 days, the largest shift at the luxury end. For homes priced between $2 million and $4 million, the Expected Market Time increased from 262 to 288 days. For homes priced above $4 million, the Expected Market Time decreased from 518 to 500 days. At 500 days, a seller would be looking at placing their home into escrow around December 2020.

Orange County Housing Market Summary:
- The active listing inventory increased by 40 homes in the past two-weeks, up 0.5%, and now totals 7,601, the highest level for 2019. In the month of June, 11% fewer homes came on the market compared to June 2018. And, so far in July, it is down by 6%. Last year, there were 6,759 homes on the market, 842 fewer than today. There are 12% more homes than last year.
- Demand, the number of pending sales over the prior month, increased by 44 pending sales in the past two-weeks, up 2%, and now totals 2,505. Last year, there were 2,393 pending sales, 4% fewer than today.
- The Expected Market Time for all of Orange County decreased from 92 days two weeks ago to 91 days today, a Balanced Market (between 90 to 120 days) and the highest level for this time of the year since 2011. It was at 85 days last year.
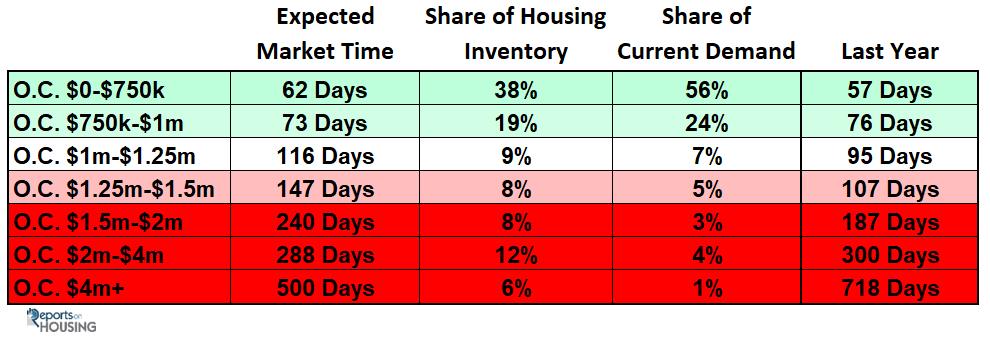
- For homes priced below $750,000, the market is a slight Seller’s Market (between 60 and 90 days) with an expected market time of 62 days. This range represents 39% of the active inventory and 56% of demand.
- For homes priced between $750,000 and $1 million, the expected market time is 73 days, a slight Seller’s Market. This range represents 19% of the active inventory and 24% of demand.
- For homes priced between $1 million to $1.25 million, the expected market time is 116 days, a Balanced Market.
- For luxury homes priced between $1.25 million and $1.5 million, in the past two weeks, the Expected Market Time increased from 143 to 147 days. For homes priced between $1.5 million and $2 million, the Expected Market Time increased from 189 to 240 days. For luxury homes priced between $2 million and $4 million, the Expected Market Time increased from 262 to 288 days. For luxury homes priced above $4 million, the Expected Market Time decreased from 518 to 500 days.
- The luxury end, all homes above $1.25 million, accounts for 34% of the inventory and only 13% of demand.
- Distressed homes, both short sales and foreclosures combined, made up only 0.7% of all listings and 1.4% of demand. There are only 22 foreclosures and 34 short sales available to purchase today in all of Orange County, 56 total distressed homes on the active market, up one in the past two-weeks. Last year there were 59 total distressed homes on the market, nearly the same as today.
- There were 2,715 closed residential resales in June, 6% fewer than June 2018’s 2,879 closed sales. June marked a 7% drop from May 2019. The sales to list price ratio was 97.6% for all of Orange County. Foreclosures accounted for just 0.5% of all closed sales, and short sales accounted for 0.4%. That means that 99.1% of all sales were good ol’ fashioned sellers with equity.
Article courtesy of Steven Thomas Quantitative Economics and Decision Sciences
Have a great week.
Roy Hernandez
TNG Real Estate Consultants
Cell 949.922.394

Leave a Reply