Hello friend!
Due to fewer pending sales, the overall housing market is not as hot as it used to be.
Pending Activity: Housing has officially been sluggish in Orange County since April 2018 and it is not changing anytime soon.
There are some mountain roads that are extremely steep. In trying to ascend it behind the wheel of a car, often the pedal is all the way to the floorboard. The engine revs loudly and the car sluggishly makes its way to the top. You want your car to zoom up the mountain, but it’s out of your control. It takes time.
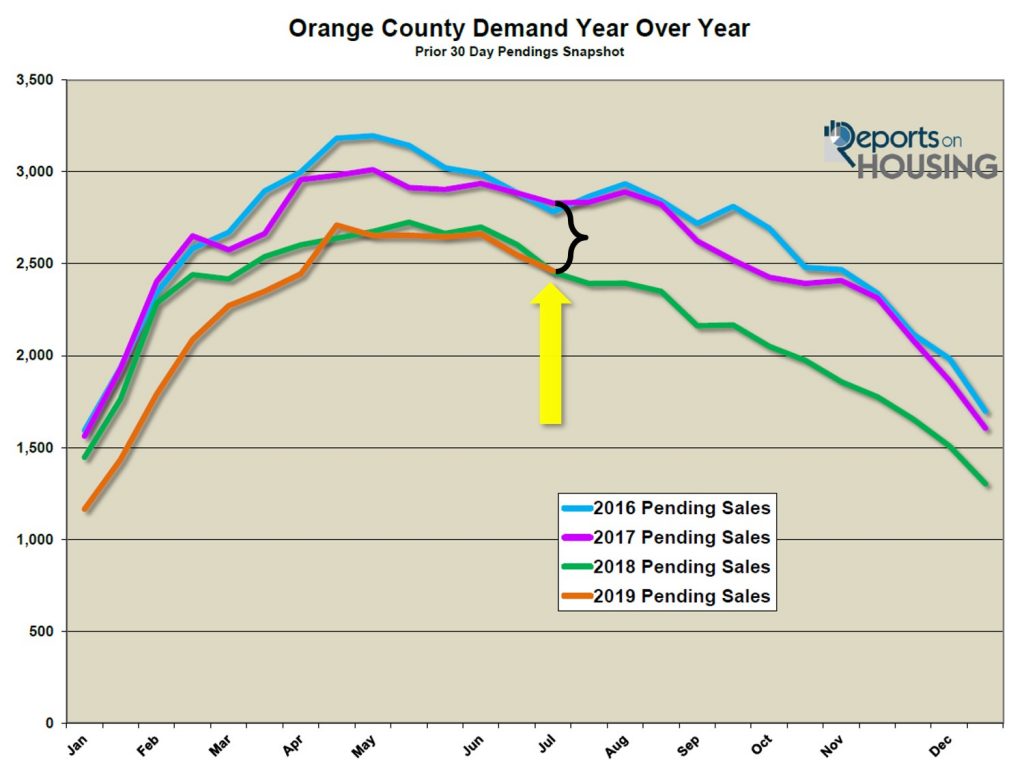
Similarly, the housing market has been moving along sluggishly since the spring of last year. In April 2018, demand (the last 30-days of pending sales) was off 11% compared to April 2017. By July 2018, it was off by 13%. As the year continued to unfold, muted demand became the new normal. After hearing how slow the market had become in 2018, many homeowners eagerly waited for 2019’s Spring Market. Yet, muted demand was not just a blip on the housing radar screen in 2018. Instead, sluggish demand had been a trend that continued to this day.
There are many experts and plenty of media reports that are beginning to talk about a robust second half to 2019. They point to the tremendous drop in interest rates as a catalyst to a sharp increase in buyer demand. Their thinking is that rates have dropped more than a full percentage point since last November, which has improved affordability dramatically. They are correct; affordability has improved considerably. The payment for a $650,000 mortgage has dropped from $3,489 per month at 5% back in November, to $3,103 per month at 4% today. That’s a savings of $386 per month or $4,632 per year.
The underlying issue is that mortgage rates have been much lower than last year, after dropping considerably in March, but they have not changed the number of pending deals at all. Demand has been lockstep with last year’s muted demand curve. Even with lower rates that have improved overall affordability, there are not as many buyers in the marketplace.

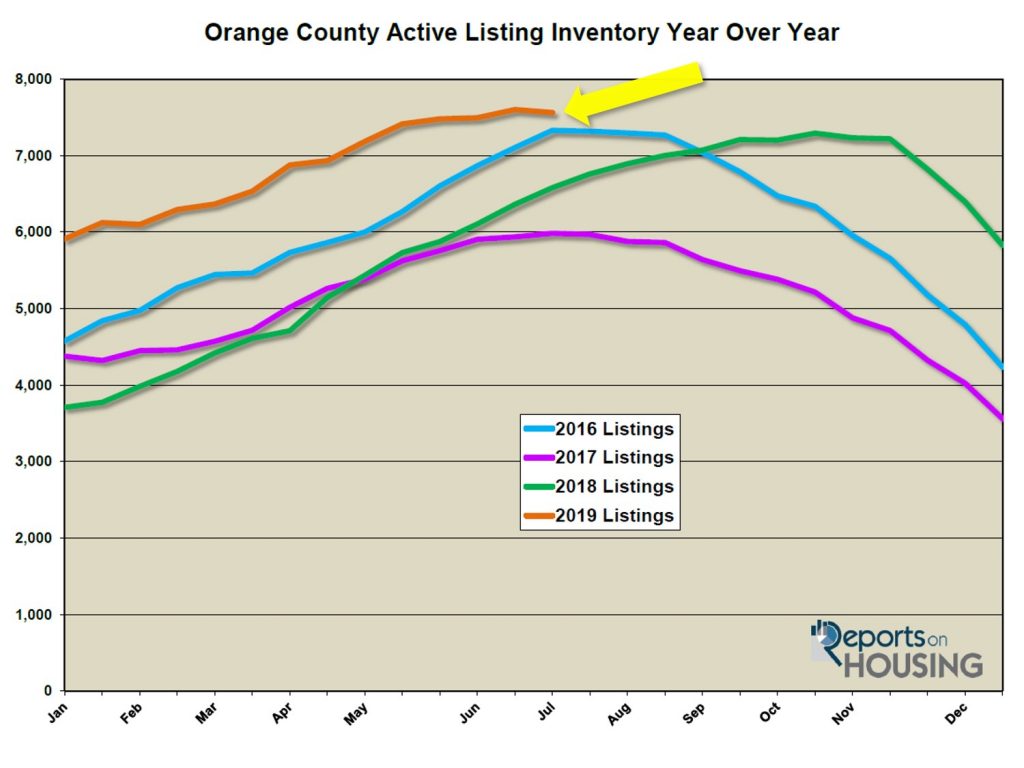
For years now, everybody has heard that there are not enough homes on the market. Many have stated that if there were more homes with FOR SALE signs in their yards, that there would be even more pending sales, and, ultimately, a lot more closed sales. That was pure speculation. There have been more homes for sale compared to the prior year since May 2018, yet demand has remained muted the entire time, 14 straight months.
For the second half of this year, the issue is going to be that there will be plenty of news stories regarding the numbers being better compared to last year. These stories need to be taken with a grain of salt. They will be comparing this year’s numbers to the second half of 2018, which were considerably muted, and interest rates climbed all the way to 5% by November. In November, year over year demand was down by 23%.
Instead, it is better to compare this year’s active listing inventory, demand, and closed sales numbers to two years ago, when the market was much hotter. It is the market that today’s sellers long for. Current demand is off by 15% compared to July 2017, and nearly identical to last year. The active listing inventory is 26% higher than July 2017, and 15% higher than last year. The Expected Market Time is 92 days, compared to 63 days in July 2017 and 80 days last year. June 2019’s closed sales are down 16% compared to June 2017, and down 6% from last year.
The moral to the real estate trend story is that despite the incredible improvement in affordability due to low mortgage rates, buyer demand remains muted. Lower rates are not igniting a run-up in demand. Instead, there is an underlying theme that nobody is talking about. Homes appreciated handsomely from 2012 through the first couple of months of 2018, rising over 70%. That rise has brought housing to a point where many can no longer afford to purchase, and are sitting on the sidelines. With sluggish demand, for the remainder of 2019, sellers should expect fewer closed sales and a market where pricing is absolutely crucial in order to find success.
Active Inventory: The current active inventory decreased by 39 homes in the past two weeks.
In the past two weeks, the active listing inventory decreased by only 39 homes, down 0.5%, and now totals 7,561. The active listing inventory typically continues to rise until peaking in July or August. However, in the month of June, 12% fewer homes came on the market compared to June 2018. Only time will tell if this trend continues. Fewer homes coming on the market eases competition a bit. This recent phenomenon has not had an impact on the overall market yet. Last year at this time there were 6,579 homes on the market. That means that there are 15% more homes available today. This continues to be the highest level of homes on the market for this time of the year since 2011.

Demand: In the past four weeks, demand dropped significantly by 8% and housing transitioned into a Balanced Market.
Demand, the number of new pending sales over the prior month, dropped by 200 pending sales in the past four weeks, down 8%, and now totals 2,461. Demand continues to drop during the Summer Market, typical for this time of the year. The real story is how demand remains subdued despite the extremely favorable drop in interest rates. The low rates are failing to ignite demand. Demand will drop through the rest of summer and then will downshift when the kids go back to school at the end of August, the beginning of the Autumn Market.
Last year at this time, there were 7 fewer pending sales, nearly identical to today. Two years ago, it was 15% stronger than today.
The current Expected Market Time increased from 89 days to 92 days in the past two weeks, a Balanced Market (90 to 120 days), one that does not favor sellers or buyers. The market has slowed to February levels. Last year, the Expected Market Time was at 80 days, better than today.
Luxury End: The luxury market slowed slightly in the past couple of weeks.
In the past two-weeks, demand for homes above $1.25 million decreased by 7 pending sales, a 2% drop, and now totals 345, its lowest level since February. The luxury home inventory dropped by 27 homes and now totals 2,522, a 1% drop and identical to a month ago. The overall Expected Market Time for homes priced above $1.25 million increased from 217 days to 219 over the past two-weeks, extremely sluggish.
Year over year, luxury demand is up by 15 pending sales, or 5%, and the active luxury listing inventory is up by an additional 328 homes, or 15%. Extra seller competition and continued muted demand compared to 2017 (the last time the luxury range was stronger) is a trend that will persist for the remainder of the year. The expected market time last year was at 199 days, slightly better than today.
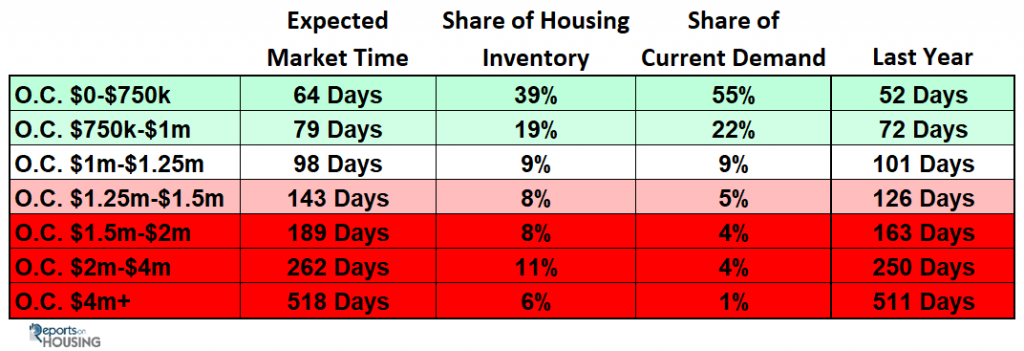
For homes priced between $1.25 million and $1.5 million, in the past two-weeks, the Expected Market Time increased from 118 to 143 days. For homes priced between $1.5 million and $2 million, the Expected Market Time decreased from 192 to 189 days. For homes priced between $2 million and $4 million, the Expected Market Time increased from 250 to 262 days. For homes priced above $4 million, the Expected Market Time decreased from 667 to 518 days. At 518 days, a seller would be looking at placing their home into escrow around December 2020.

Orange County Housing Market Summary:
- The active listing inventory decreased by 39 homes in the past two weeks, down 1%, and now totals 7,561. In the month of June, 12% fewer homes came on the market compared to June 2018. Last year, there were 6,579 homes on the market, 982 fewer than today. There are 15% more homes than last year.
- Demand, the number of pending sales over the prior month, decreased by 87 pending sales in the past two-weeks, down 3%, and now totals 2,461. Last year, there were 2,454 pending sales, similar to today.
- The Expected Market Time for all of Orange County increased from 89 days two weeks ago to 92 days today, a Balanced Market (between 90 to 120 days) and the highest level for this time of the year since 2011. It was at 80 days last year.
- For homes priced below $750,000, the market is a slight Seller’s Market (between 60 and 90 days) with an expected market time of 64 days. This range represents 39% of the active inventory and 55% of demand.
- For homes priced between $750,000 and $1 million, the expected market time is 79 days, a slight Seller’s Market. This range represents 19% of the active inventory and 22% of demand.
- For homes priced between $1 million to $1.25 million, the expected market time is 98 days, a Balanced Market.
- For luxury homes priced between $1.25 million and $1.5 million, in the past two weeks, the Expected Market Time increased from 137 to 143 days. For homes priced between $1.5 million and $2 million, the Expected Market Time decreased from 192 to 189 days. For luxury homes priced between $2 million and $4 million, the Expected Market Time increased from 250 to 262 days. For luxury homes priced above $4 million, the Expected Market Time decreased from 667 to 518 days.
- The luxury end, all homes above $1.25 million, accounts for 35% of the inventory and only 14% of demand.
- Distressed homes, both short sales and foreclosures combined, made up only 0.7% of all listings and 1.5% of demand. There are only 20 foreclosures and 35 short sales available to purchase today in all of Orange County, 55 total distressed homes on the active market, identical to the number two-weeks. Last year there were 64 total distressed homes on the market, slightly more than today.
- There were 2,715 closed residential resales in June, 6% fewer than June 2018’s 2,879 closed sales. June marked a 7% drop from May 2019. The sales to list price ratio was 97.6% for all of Orange County. Foreclosures accounted for just 0.5% of all closed sales, and short sales accounted for 0.4%. That means that 99.1% of all sales were good ol’ fashioned sellers with equity.
Article courtesy of Steven Thomas Quantitative Economics and Decision Sciences
Sincerely,
Roy Hernandez
TNG Real Estate Consultants
949.922.3947
Realtor@Royalagent.net

Copyright 2019 – Steven Thomas, Reports On Housing – All Rights Reserved. This report may not be reproduced in whole or part without express written permission by author.

Leave a Reply