Many buyers and sellers are holding out for a major shift in the market favoring their point of view, but housing is not changing anytime soon.
Status Quo: For the rest of the year, the housing market is not going to change much at all.
There is an old saying, “If it looks like a duck, swims like a duck, and quacks like a duck, then it probably is a duck.” No matter how hard you wish it was something else, it is still a duck at the end of the day.
Today’s housing market is a slight Seller’s Market. That is when homes are not appreciating much at all, but sellers get to call more of the shots during the negotiating process. For buyers and sellers, wishing that the market was different is a complete waste of time.
Many buyers and sellers are holding out and hoping for a change in the market. Buyers want to see housing slow to a crawl like it did in the last four months of 2018 where, for a moment, they were in the driver’s seat. They would love to see prices come down, after all, aren’t values too high?
Sellers expect the housing market to behave like it did from 2012 through 2017. Boy those were HOT years!! They should once again be able to stretch their housing price and get $15 or $20,000 more than the last sale with multiple offers within the first couple of weeks, right?
This kind of thinking is stinking thinking. Neither are correct. What you see in the market today is ultimately what you are going to see for the rest of the year. More simply, it is what it is; what you see is what you get. Values are not going to grow much. The overall pace of housing is not going to change. Housing is going to move along at the same clip. Buyers think that the end of the year is the BEST time of the year to buy. Nope! What you see is what you get. Sellers think that the market is going to suddenly heat up. Nope! What you see is what you get.

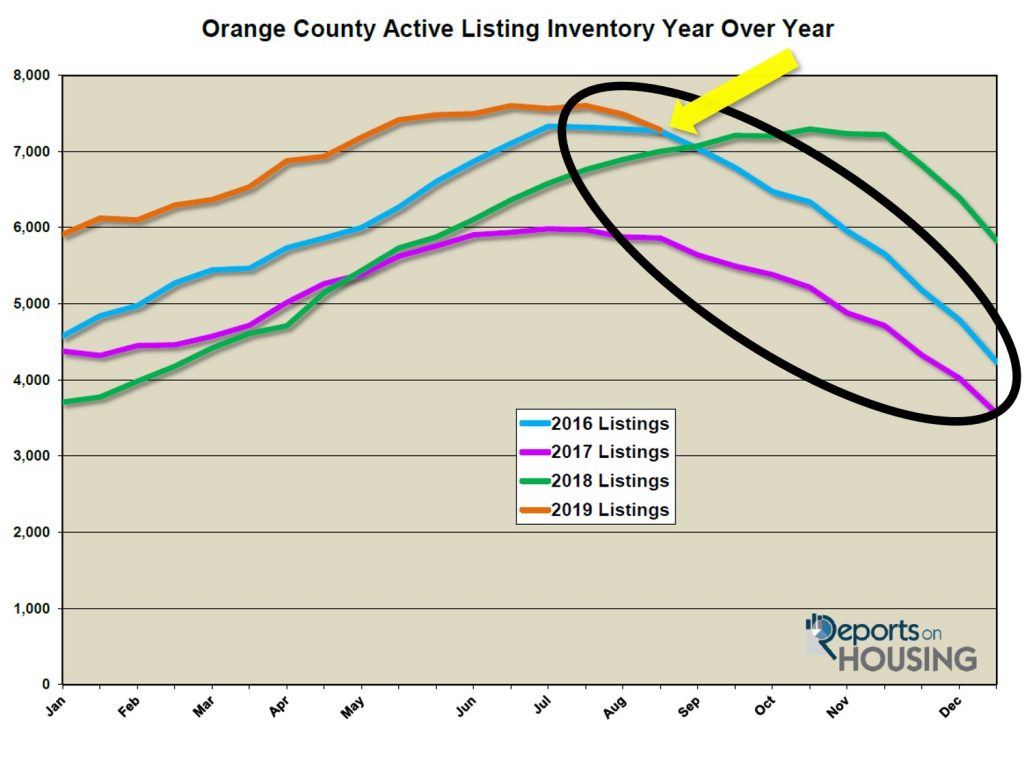
Here is how the rest of the year is going to play out. With the kids back in school, it is officially the Autumn Market. The Spring and Summer Markets are now in the past. The busiest time of the year for real estate is in the rearview mirror. From right now, today, the active inventory will drop for the rest of the year. In Orange County, the current active inventory peaked at the end of July with 7,601 homes on the market. It had grown by 29% since then beginning of the year. Yet, in the last month, the inventory has already dropped by 294 homes, or 4%, and now sits at 7,307.
Now that it is the Autumn Market, there will be fewer new homes that enter the fray. Combine that with many unsuccessful sellers throwing in the towel and pulling their homes off the market and you have the recipe for an active inventory that will continuously drop. As the year progresses, there will be fewer and fewer choices for buyers. That is normal. Last year, the inventory grew on the backs of rising rates, which is not normal. Current rates are at a three-year low. The inventory is going to do what it normally does at the end of the year, consistently drop. On average, it drops 37% after reaching a peak during the Summer Market.
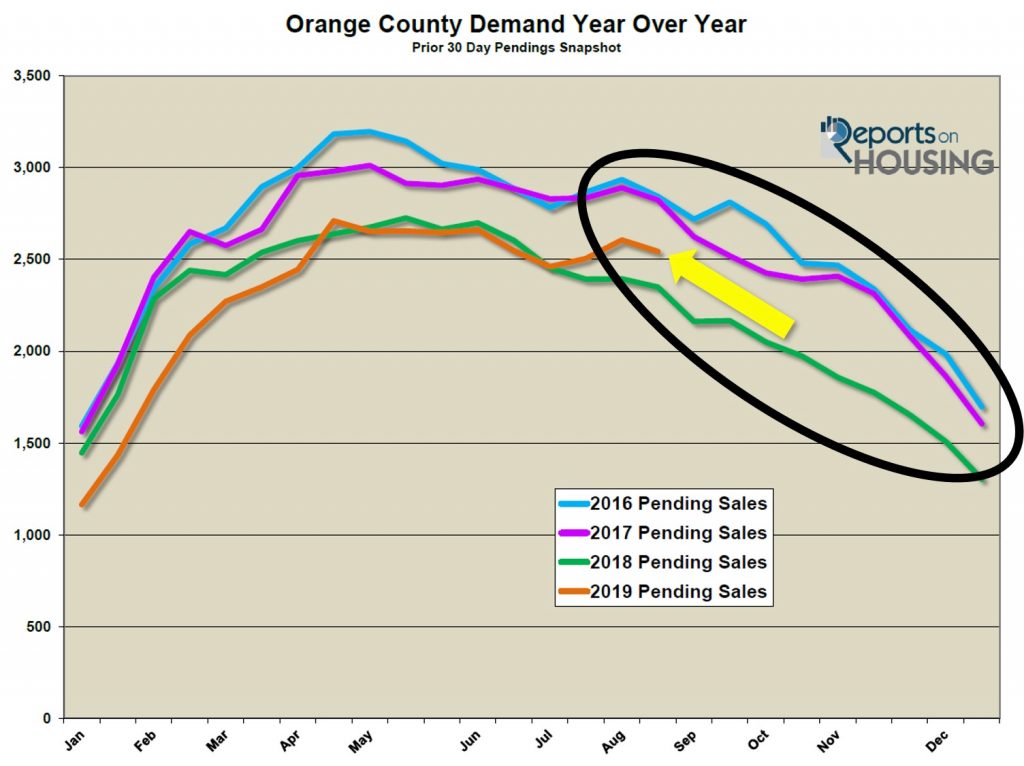
At the same time, buyer demand will drop slowly but surely for the remainder of the year. It just is not the most advantageous time for families to move with the kids back in school, so demand continuously drops. It picks up steam in November and December with all the distractions of the holidays. On average, in the last decade, it has dropped by 35% from August through the end of the year.

With both supply and demand dropping at nearly the same rate, the velocity of the market will not change much as well. What you see is what you get. The Expected Market Time, the amount of time it would take from listing a home to placing it in escrow down the road, has increased, on average, by only 2% from August through December during years where housing peaks during the summer. The current Expected Market Time is at 86 days. A 2% change would be an increase to 88 days, nearly unnoticeable for anyone in the real estate trenches.
Buyers and sellers need to be careful with their wild expectations. They need to be based upon the realities of today’s housing market, not what they wish for… what you see is what you get.
Active Inventory: The current active inventory shed 181 homes in the past two-weeks.In the past two-weeks, the active listing inventory dropped by 181 homes, down 2%, and now totals 7,307, the largest drop of the year. The significant drop illustrates the direction that the active listing inventory will be heading for the remainder of the year: DOWN. There are fewer homeowners opting to list their homes during this time of the year and many unsuccessful sellers are throwing in the towel with the best time of the year officially in the rearview mirror.
Last year at this time, there were 7,001 homes on the market, 306 fewer, or 4% less. Two years ago, there were 20% fewer homes on the market compared to today.
Demand: In the past two-weeks, demand decreased by 2%. Demand, the number of new pending sales over the prior month, decreased by 58 pending sales in the past two-weeks, down 2%, and now totals 2,548. With the kids back in school, demand slowly and methodically drops for the rest of the year. It is just not the most advantageous time for families to move. Most families prefer to move when it is easiest on the kids, during the summer months, from June through mid-August while their kids are enjoying their summer break.
Last year at this time, there were 198 fewer pending sales than today. Current demand is still muted, just not as severe as this time last year when interest rates were climbing. Two years ago, it was 11% stronger than today.
In the past two-weeks, the Expected Market Time remained unchanged at 86 days, a slight Seller’s Market (60 to 90 days), where home values do not change much, and sellers get to call more of the shots during the negotiating process. Last year, the Expected Market Time was at 89 days, a little slower than today.
Luxury End: The luxury market continued to improve in the past couple of weeks.In the past two-weeks, demand for homes above $1.25 million increased by 18 pending sales, a 5% increase, and now totals 349, the highest level since June. The luxury home inventory decreased by 46 homes and now totals 2,461, a 2% drop. It too reached a peak four weeks ago and is descending like the rest of the active inventory. The overall Expected Market Time for homes priced above $1.25 million decreased from 227 days to 212 over the past two-weeks, better, but still sluggish.
Year over year, luxury demand is up by 4 pending sales, or 1%, and the active luxury listing inventory is up by an additional 328 homes, or 15%. The expected market time last year was at 185 days, better than today.
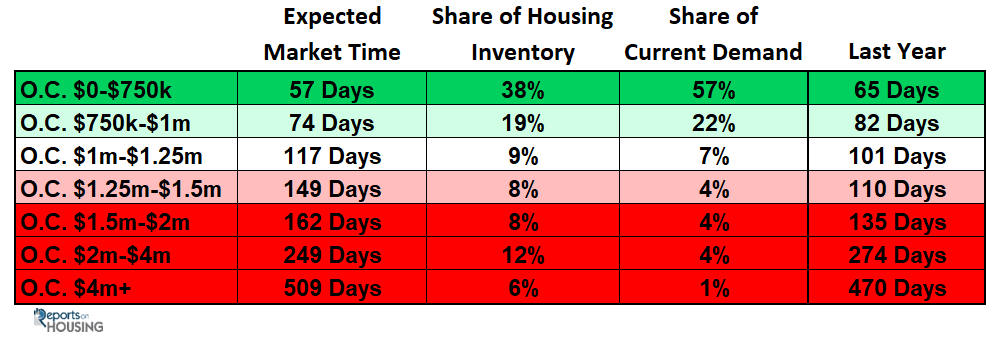
For homes priced between $1.25 million and $1.5 million, in the past two-weeks, the Expected Market Time increased from 130 to 149 days. For homes priced between $1.5 million and $2 million, the Expected Market Time decreased from 240 to 162 days. For homes priced between $2 million and $4 million, the Expected Market Time decreased from 280 to 249 days. For homes priced above $4 million, the Expected Market Time increased from 404 to 509 days. At 509 days, a seller would be looking at placing their home into escrow around January 2021.

Orange County Housing Market Summary:
- The active listing inventory decreased by 181 homes in the past two-weeks, down 2%, and now totals 7,307. The inventory reached a peak for the year of 7,601 four-weeks ago. Last year, there were 7,001 homes on the market, 306 fewer than today, 4% less. Two years ago, there were 20% fewer homes on the market.
- Demand, the number of pending sales over the prior month, decreased by 81 pending sales in the past two-weeks, down 2%, and now totals 2,548. Last year, there were 2,350 pending sales, 8% fewer than today. Two years ago, demand was 11% stronger than today.
- The Expected Market Time for all of Orange County remained unchanged at 86 days, a slight Seller’s Market (between 60 to 90 days). It was at 89 days last year.
- For homes priced below $750,000, the market is a hot Seller’s Market (less than 60 days) with an expected market time of 57 days. This range represents 38% of the active inventory and 57% of demand.
- For homes priced between $750,000 and $1 million, the expected market time is 74 days, a slight Seller’s Market. This range represents 19% of the active inventory and 22% of demand.
- For homes priced between $1 million to $1.25 million, the expected market time is 117 days, a Balanced Market.
- For luxury homes priced between $1.25 million and $1.5 million, in the past two weeks, the Expected Market Time increased from 130 to 149 days. For homes priced between $1.5 million and $2 million, the Expected Market Time decreased from 244 to 162 days. For luxury homes priced between $2 million and $4 million, the Expected Market Time decreased from 280 to 249 days. For luxury homes priced above $4 million, the Expected Market Time increased from 404 to 509 days.
- The luxury end, all homes above $1.25 million, accounts for 34% of the inventory and only 13% of demand.
- Distressed homes, both short sales and foreclosures combined, made up only 0.7% of all listings and 1.4% of demand. There are only 20 foreclosures and 32 short sales available to purchase today in all of Orange County, 52 total distressed homes on the active market, down five in the past two-weeks. Last year there were 58 total distressed homes on the market, slightly more than today.
- There were 2,871 closed residential resales in July, 5% more than July 2018’s 2,734 closed sales. July marked a 6% increase compared to June 2019. The sales to list price ratio was 98.3% for all of Orange County. Foreclosures accounted for just 0.5% of all closed sales, and short sales accounted for 0.24%. That means that 99.3% of all sales were good ol’ fashioned sellers with equity.
Article courtesy of Steven Thomas, Quantitative Economics and Decisions Sciences
Have a nice week, and a safe Labor Day weekend!

Roy Hernandez
TNG Real Estate Consultants
Realtor@Royalagent.net
Cell/Text 949.922.3947


Leave a Reply