Hello!
The lack of homes for sale in Orange County has hit pending
sales activity.
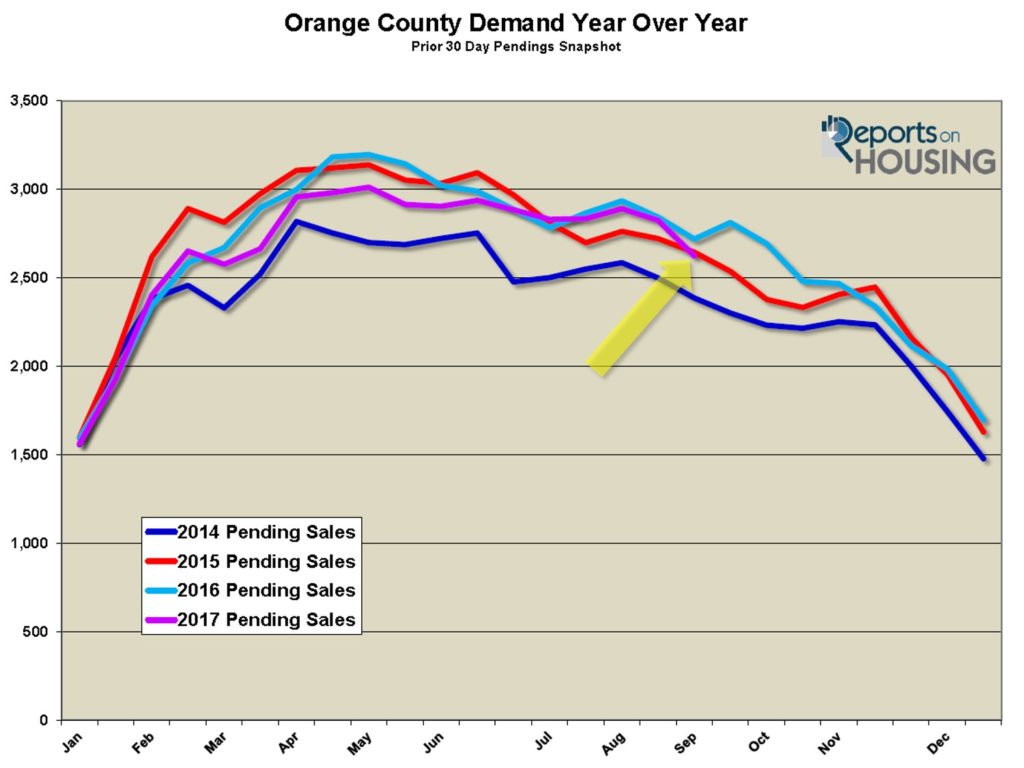
Supply Cuts Pending Sales: The number of pending sales over the past month dropped by 7% due to a supply of homes that is now dropping as well.
Homeowners have been behaving differently ever since the Great Recession began a decade ago. A trend evolved and it has not changed since 2008. That trend is a drought of homeowners opting to sell their homes. In fact, this year it has been even more pronounced.
The number of homes placed on the market this year is the second lowest level this century behind 2012. The lack of homes FOR SALE back then was understandable as home values were only starting to rise and many homeowners were upside down in their homes, owing more than their homes were worth. Flash forward five years later to today and home values have appreciated substantially (the median value of a resale home has increased by more than 60%). Even with the extra equity, homeowners are opting to stay put and are not moving. The trend continues.
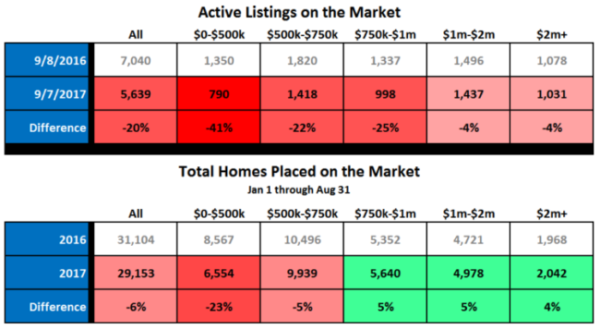
This year, there have been 7% fewer homes that have come on the market compared to last year, 2,055 fewer to be exact. For perspective, there have been 18,000 fewer FOR SALE signs this year compared to 2004. This lack of inventory has hurt the true potential for closed sales. With interest rates below 4%, buyers have been chomping at the bit to purchase; yet, they face stiff competition due to a lack of supply.
Today there are 20% fewer choices on the market compared to last year, 5,639 versus 7,040. As a result, the number of pending sales over the prior month (how Reports On Housing gauges demand), dropped in the past couple of weeks by 7%, with 201 fewer pending sales, now totaling 2,624. Today’s demand is 3% off of last year’s 2,719. The lack of supply is truly cutting into the number of pending sales and has undercut demand.

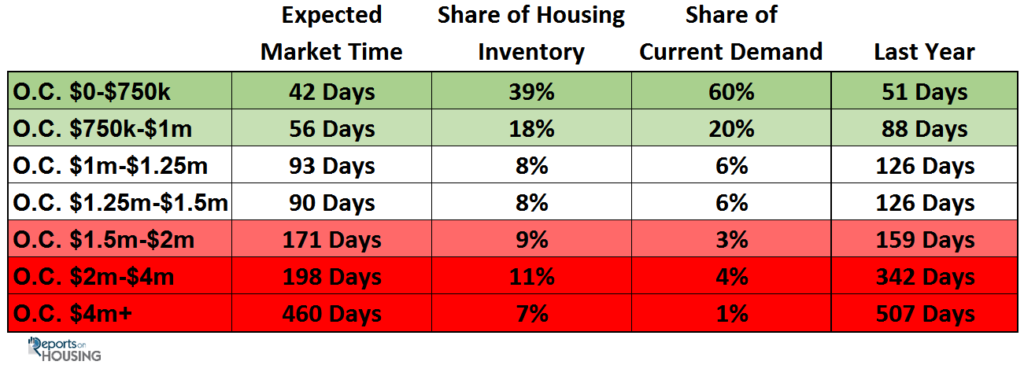
True demand, buyers ready, willing and able to buy today, is much higher than the pending sales count is showing simply because of not enough choices. There are insufficient homes FOR SALE in the lower ranges, homes priced below $750,000. This range accounts for 39% of the inventory and 60% of demand. If there were more homes available within this range, the number of pending sales, and ultimately closed sales, would skyrocket. This price range is underserved as fewer and fewer homeowners are electing to sell. There are 41% fewer active listings available today below $500,000 compared to last year, and the expected market time (the amount of time it will take a home placed on the market today to open escrow) is a blistering hot 36 days. There are 22% fewer homes available between $500,000 and $750,000, and the expected market time is a hot 46 days. These hot markets are a direct result of a skimpy supply all year long.
There are 25% fewer homes on the market between $750,000 to $1 million, yet the expected market time is at 56 days, not as hot as the lower price ranges. Even though there are fewer choices for buyers, sellers better be priced on the money or they won’t be successful. For homes priced above $1 million, there may be slightly fewer homes on the market compared to last year; however, the expected market time runs from 93 days ($1 million to $1.25 million) to 460 days ($4 million and up). These sellers not only need to be priced precisely on target, they must pack their patience as well.

The bottom line: the Orange County housing market could use more homes on the market, especially in the lower ranges. This lack of inventory has diminished the number of pending and closed sales and has prevented local housing from reaching its full potential.
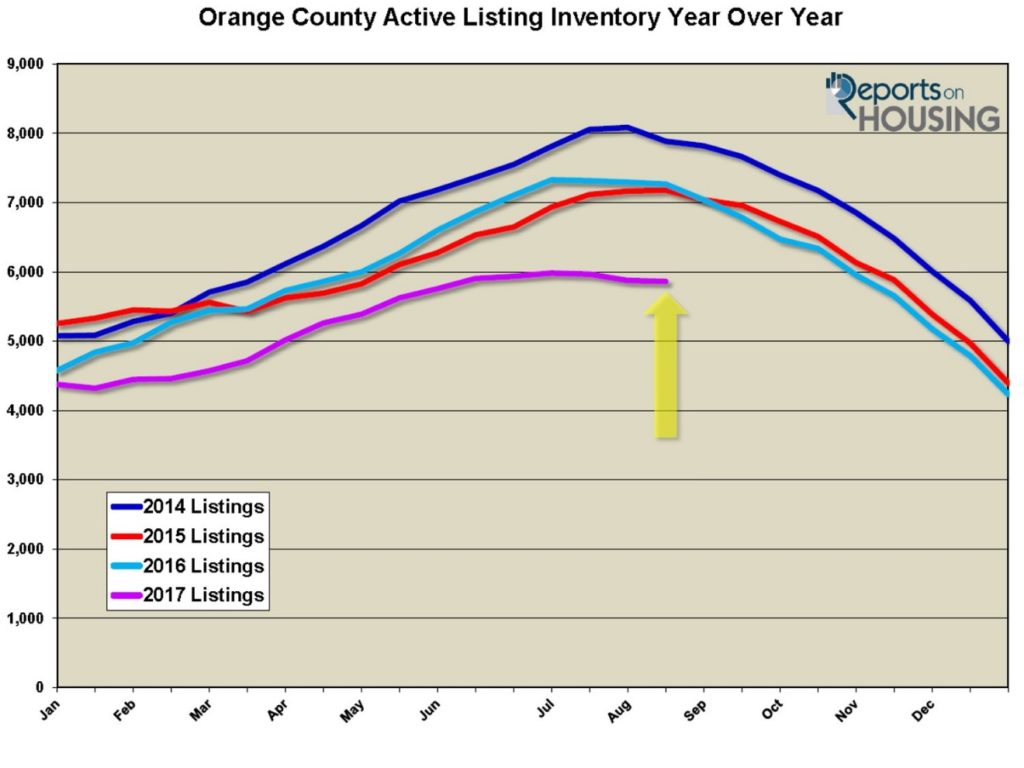
Active Inventory: The active inventory dropped by 4% over the past couple of weeks. The active listing inventory shed 223 homes in the past two weeks and now sits at 5,639. It is the lowest level for this time of the year since 2012. The active inventory is falling as expected now that the Autumn Market is here. It will continue to trend down through the remainder of the year, picking up steam after Thanksgiving, the start of the Holiday/Winter Market.
Last year at this time, there were 7,040 homes on the market, 1,401 additional homes or 25% more than today.

Demand: Demand decreased by 7% in the past couple of weeks.
Demand, the number of homes placed into escrow within the prior month, decreased by 201 pending sales, or 7%, in the past two-weeks and now totals 2,624. The drop is primarily due to a lack of available choices in the lower ranges below $750,000. For homes priced above $750,000, with the only exception being homes between $1.5 million to $2 million, demand is actually up year over year. There have also been slightly more homes placed on the market year over year for these higher price ranges.
Last year at this time, demand was at 2,719 pending sales, 95 more than today.
Luxury End: Luxury demand plunged by 7% in the past couple of weeks and the inventory dropped by 1%.
In the past two weeks, demand for homes above $1.25 million decreased from 385 to 358 pending sales, a 7% drop. The luxury home inventory decreased from 2,002 homes to 1,979, a 1% drop. As a result, the expected market time for all homes priced above $1.25 million increased from 156 days to 166 days. The luxury inventory and demand will continue to drop through the end of the year.
For homes priced between $1.25 million and $1.5 million, the expected market time decreased from 98 to 90 days. For homes priced between $1.5 million and $2 million, the expected market time increased from 134 to 171 days. For homes

priced between $2 million and $4 million, the expected market time increased from 185 days to 198 days. In addition, for homes priced above $4 million, the expected market time decreased from 462 to 460 days. At 460 days, a seller would be looking at placing their home into escrow around the mid-December 2018.
Orange County Housing Market Summary:
• The active listing inventory decreased by 223 homes in the past couple of weeks, and now totals 5,639. The trend is down for the remainder of the year. Last year, there were 7,040 homes on the market, 1,401 more than today.
• There are 41% fewer homes on the market below $500,000 today compared to last year at this time and demand is down by 21%. Fewer and fewer homes and condominiums are now priced below $500,000. This price range is slowly disappearing.
• Demand, the number of pending sales over the prior month, decreased by 201 homes in the past couple of weeks, down 7%, and now totals 2,624. The average pending price is $860,101.
• The average list price for all of Orange County increased from $1.6 million to $1.7 million. This number is high due to the mix of homes in the luxury ranges that sit on the market and do not move as quickly as the lower end.
• For homes priced below $750,000, the market is HOT with an expected market time of just 42 days. This range represents 39% of the active inventory and 60% of demand.
• For homes priced between $750,000 and $1 million, the expected market time is 56 days, a hot seller’s market (less than 60 days). This range represents 18% of the active inventory and 20% of demand.
• For homes priced between $1 million to $1.25 million, the expected market time is 93 days, a balanced market that does not favor a buyer or seller.
• For luxury homes priced between $1.25 million and $1.5 million, the expected market time decreased from 98 days to 93. For homes priced between $1.5 million and $2 million, the expected market time increased substantially from 134 to 171 days. For luxury homes priced between $2 million and $4 million, the expected market time increased from 185 days to 198 days. For luxury homes priced above $4 million, the expected market time decreased from 462 to 460 days.
• The luxury end, all homes above $1.25 million, accounts for 34% of the inventory and only 14% of demand.
• The expected market time for all homes in Orange County increased in the past couple of weeks from 61 days to 62 days, a tepid seller’s market (60 to 90 days). From here, we can expect the market time to slowly rise as housing makes its way through the Autumn Market.
• Distressed homes, both short sales and foreclosures combined, make up only 1.5% of all listings and 2.4% of demand. There are only 33 foreclosures and 54 short sales available to purchase today in all of Orange County, that’s 87 total distressed homes on the active market, increasing by 5 in the past two weeks. Last year there were 125 total distressed sales, 44% more than today.
• There were 3,110 closed sales in August, a 12% increase over July 2017 and a 1.3% increase over August 2016. The sales to list price ratio was 98.1% for all of Orange County. Foreclosures accounted for just 0.8% of all closed sales and short sales accounted for 0.7%. That means that 98.5% of all sales were good ol’ fashioned equity sellers.
Have a great week.
Sincerely,
Roy A. Hernandez
TNG Real Estate Consultants
Cell 949.922.3947
[gravityform id=”22″ title=”true” description=”true”]

It’s not my first time to pay a quick visit this site, i am visiting this web page dailly and obtain pleasant data from here everyday.
[url=https://www.fantasycostumes.com/candelabra-costume-adult/]velma costume adults[/url]