
It appears as if the shock of COVID-19 and its impact on demand bottomed two weeks ago and is now on the rise. Expect demand to continue to rise going forward, especially with the added inventive of record low mortgage rates. In fact, they reached an all-time low last week, dropping to an average of 3.23% across the country. With lower rates, homes become much more affordable.
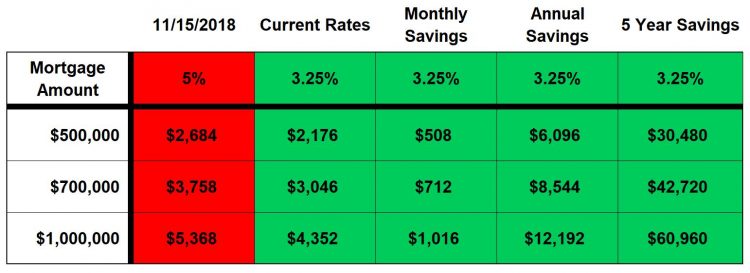
For example, in looking at a $700,000 mortgage, the monthly payment at 3.25% is $3,046 per month. That is a $712 per month savings, or $8,544 per year, compared to where rates were in November 2018, just a year-and-a-half ago. The savings are staggering, which helps explain why demand is starting to rise. It is hard to ignore the impact on affordability as rates hit these unprecedented levels.
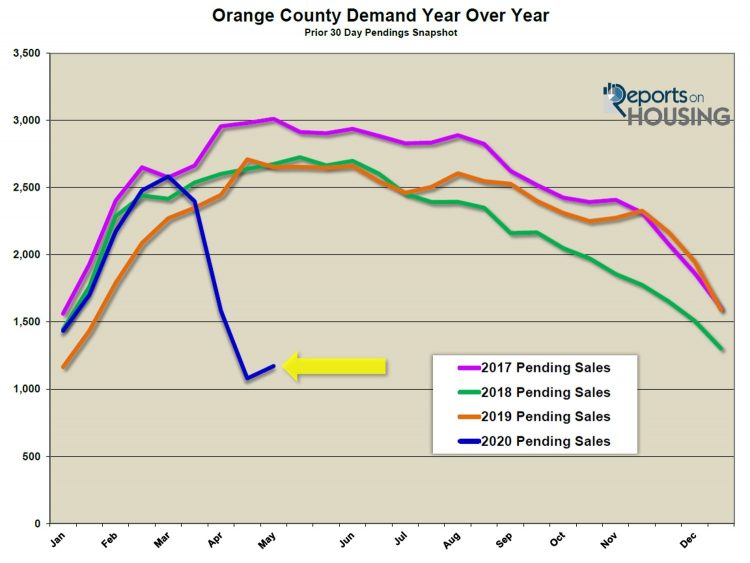
Even with the large increase in demand over the past couple of weeks, demand is still muted. Its current level was last seen in January 2018, a snapshot of what happens to the velocity of pending sales when rates rose to 5%. Demand is also off by 56% compared to last year. So, COVID-19 is absolutely suppressing demand.
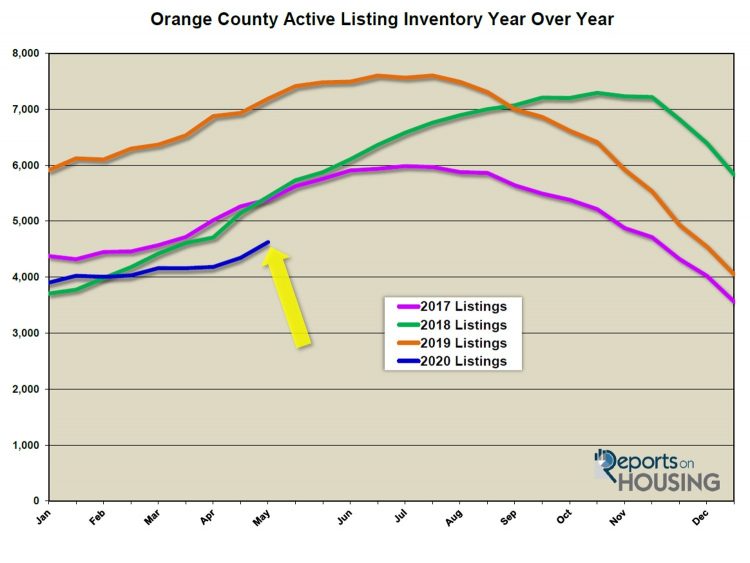
Within the last couple of weeks, the inventory grew by 6%, adding 281 homes, and it now totals 4,625. Yet, COVID-19 is also suppressing the active listing inventory. 54% fewer homes were placed on the market within the last four weeks compared to the 5-year average, 1,807 homes versus 3,889.
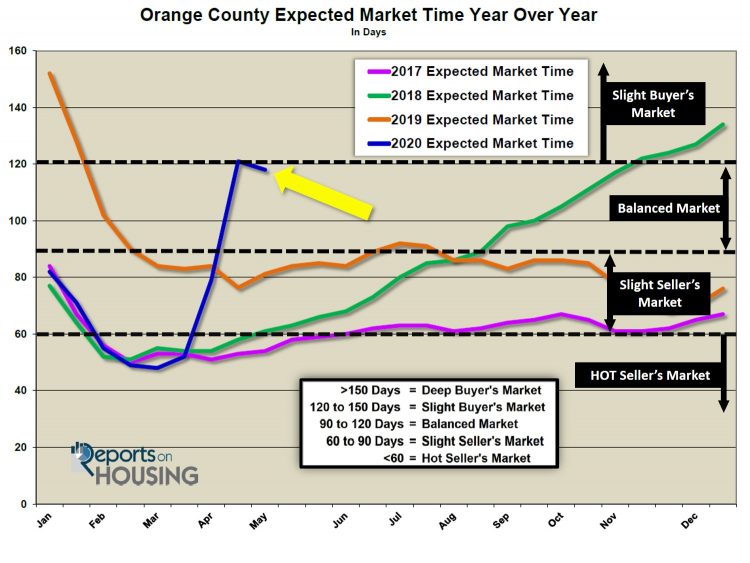
With demand increasing at a faster pace than the supply of homes, the Expected Market Time (the amount of time from hammering in the FOR SALE sign to opening escrow down the road) dropped from 121 days to 118 days, a Balanced Market (between 90 and 120 days). A Balanced Market does not favor buyers or sellers and home values do not change much at all. It is the first drop in the Expected Market Time since the start of the “stay at home” order back in March. From here, expect demand to continue to outpace any increase in the supply. As a result, the Expected Market Time will continue to drop in the coming weeks.
For buyers in Southern California, the current environment may prove to be the best time to jump on purchasing a home given that there is no rush to act immediately and rates are at all-time lows. That may change as California’s economy is slowly opened back up. Even so, it will not be business as usual. The new adaptation to selling homes in this COVID-19 environment will continue.
The market may not be firing on all cylinders like it was in February and the start of March when homes were flying off the market and obtaining multiple offers, but it is starting to turn a corner with both demand on the rise and the Expected Market Time falling for the first time in a couple of months.
Active Inventory: The current active inventory increased by 6% in the past two-weeks. The active listing inventory increased by 281 homes in the past two-weeks, up 6%, and now sits at 4,625. It is the largest increase so far this year. Yet, the current level is at the lowest level for this time of the year since 2013. There are still not that many homes on the market as COVID-19 is suppressing the number of homeowners entering the fray. In the past 4-weeks, there were 54% fewer new FOR SALE signs compared to the prior 5-year average. Expect this to continue until the economy is reopened down the road.
Last year at this time, there were 7,185 homes on the market, 2,560 more than today, a 55% difference. There were a lot more choices for buyers last year.
Luxury End: The luxury market is starting to improve. In the past two-weeks, demand for homes above $1.25 million increased by 17 pending sales, up 12%, and now totals 157. The luxury home inventory increased by 70 homes, up 5%, and now totals 1,571. Many luxury homeowners will continue to opt to wait to list their homes until after the economy opens back up, and demand will remain at lower levels as well. With the growth in demand outpacing the rise in the inventory, the overall Expected Market Time for homes priced above $1.25 million decreased from 322 to 300 days in the past couple of weeks.
Year over year, luxury demand is down by 235 pending sales, or 60%, and the active luxury listing inventory is down by 798 homes, or 34%. The Expected Market Time last year was at 181 days, much better than today.
For homes priced between $1.25 million and $1.5 million, in the past two-weeks, the Expected Market Time decreased from 205 to 192 days. For homes priced between $1.5 million and $2 million, the Expected Market Time decreased from 252 to 229 days. For homes priced between $2 million and $4 million, the Expected Market Time increased from 363 to 418 days. For homes priced above $4 million, the Expected Market Time decreased from 1,118 to 586 days. At 586 days, a seller would be looking at placing their home into escrow around December 2021.
Orange County Housing Market Summary:
1. The active listing inventory increased by 281 homes in the past two-weeks, up 6%, and now totals 4,625, its largest increase of the year. In the past four-weeks, 54% fewer homes were placed on the market compared to the prior 5-year average; thus, COVID-19 is suppressing the inventory. Last year, there were 7,185 homes on the market, 2,560 more than today, a 55% difference.
2. Demand, the number of pending sales over the prior month, increased by 92 pending sales in the past two-weeks, up 9%, and now totals 1,172, its first increase since the “stay at home” order was placed back in March. In the past 5-years, demand has increased an average of 0%. COVID-19 is continuing to suppress demand; yet, the bottom was reached a couple of weeks ago. Last year, there were 2,653 pending sales, 126% more than today.
3. The Expected Market Time for all of Orange County decreased from 121 days to 118, a Balanced Market (between 90 and 120 days). The drop was due to the rise in demand outpacing the rise in the supply. It was at 81 days last year, much better than today.
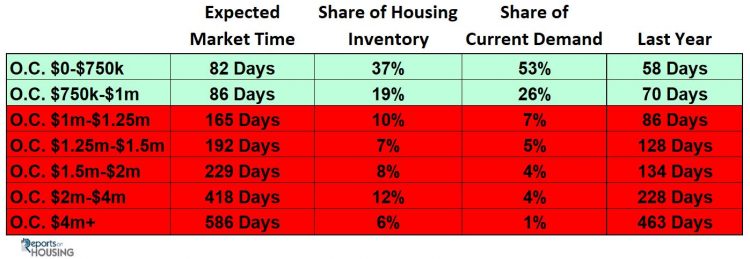
4. For homes priced below $750,000, the market is a slight Seller’s Market (between 60 and 90 days) with an expected market time of 82 days. This range represents 37% of the active inventory and 53% of demand.
5. For homes priced between $750,000 and $1 million, the expected market time is 86 days, a slight Seller’s Market. This range represents 19% of the active inventory and 26% of demand.
6. For homes priced between $1 million to $1.25 million, the expected market time is 165 days, a Buyer’s Market (greater than 150 days).
7. For luxury homes priced between $1.25 million and $1.5 million, in the past two weeks, the Expected Market Time decreased from 205 to 192 days. For homes priced between $1.5 million and $2 million, the Expected Market Time decreased from 252 to 229 days. For luxury homes priced between $2 million and $4 million, the Expected Market Time increased from 363 to 418 days. For luxury homes priced above $4 million, the Expected Market Time decreased from 1,118 to 586 days.
8. The luxury end, all homes above $1.25 million, accounts for 33% of the inventory and only 14% of demand.
9. Distressed homes, both short sales and foreclosures combined, made up only 1% of all listings and 1.6% of demand. There are only 18 foreclosure s and 26 short sales available to purchase today in all of Orange County, 44 total distressed homes on the active market, up3 from two-weeks ago. Last year there were 68 total distressed homes on the market, slightly more than today.
10. There were 2,383 closed residential resales in March, 5% more than March 2019’s 2,277 closed sales. March marked a 17% increase compared to February 2020. The sales to list price ratio was 98.4% for all of Orange County. Foreclosures accounted for just 0.4% of all closed sales, and short sales accounted for 0.5%. That means that 99.1% of all sales were good ol’ fashioned sellers with equity.
Make everyday the best day possible.
Contact me when the time is right,


Leave a Reply