Good Afternoon!
With an extremely low inventory and blistering demand, the
Autumn Market is poised to be the hottest in years.
A Hot Autumn: With 19% fewer FOR SALE signs this year compared to last, the Autumn Market is going to be hot.
It is that time of the year. Have you seen all of the signs? The leaves are starting to fall, the kids are back in school, and Costco already has Halloween costumes. That is right, autumn is here. The official start to autumn is not until Friday, September 22, but all of the signs are here.
As for Orange County housing, the Autumn Market typically starts around the end of August when the kids head back to their classrooms. It’s no longer the “prime” season for real estate. Both the Spring and Summer Markets are in the past. Housing will now shift gears and transition to a slower time of the year. This year will not be an exception, demand will fall, sales will fall, and the expected market time will start to rise. Nevertheless, this year will be the hottest Autumn Market since 2005.
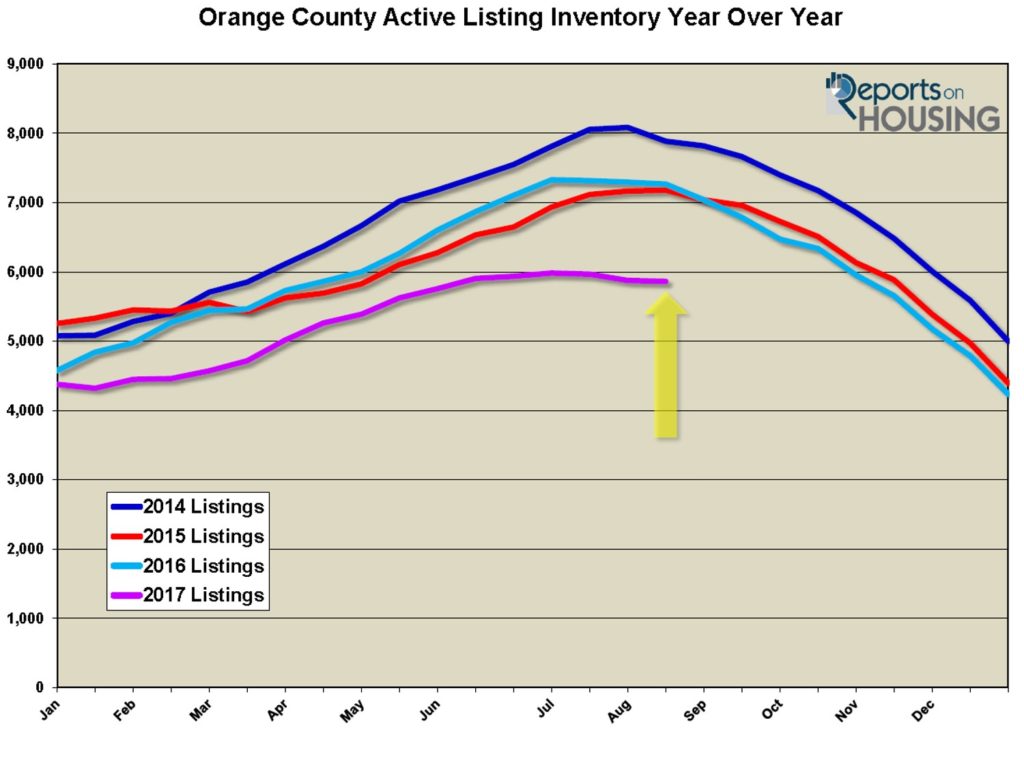
Today, there are 19% fewer FOR SALE signs on the active listing inventory right now compared to last year at this time. In fact, the last time the supply of homes was this low at the end of August dates back to 2012 when the active inventory was dropping like a rock. And, in spite of this year being the second fewest number of homeowners opting to place their homes on the market this century (2012 was the lowest), demand has remained strong. Demand, the number of new pending sales over the prior month, is still at end of March levels. As a result, the current expected market time is at levels not seen since 2013.

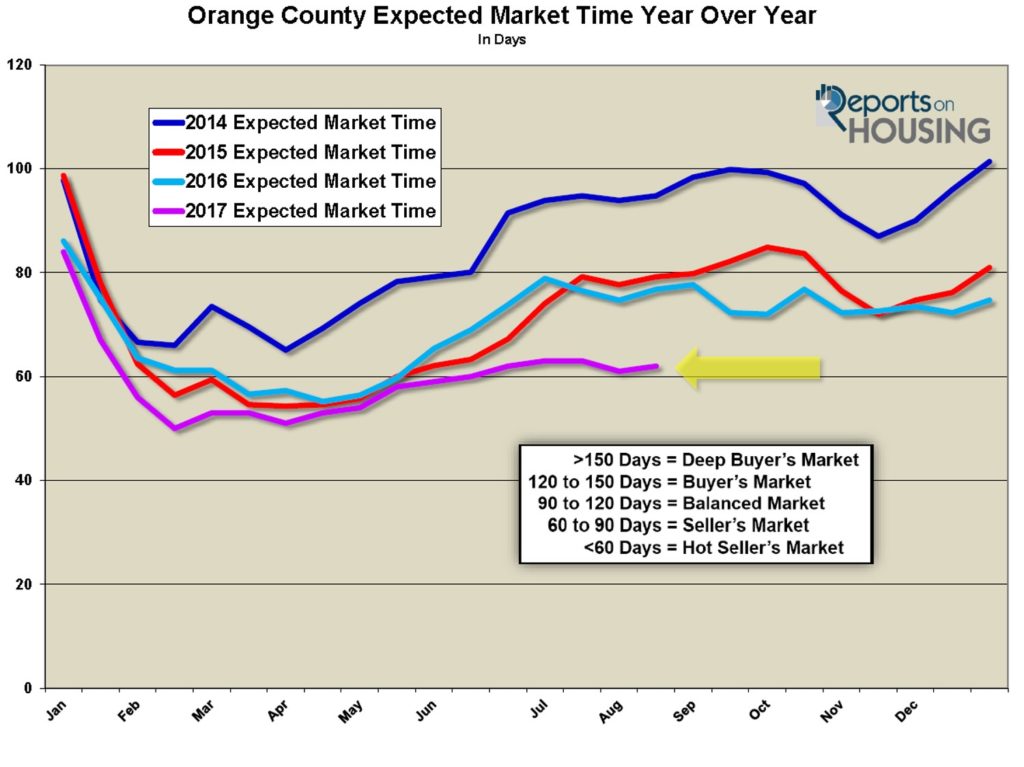
The expected market time takes into account both supply and demand. It is the amount of time a seller can expect to be on the market before opening up escrow. It is the velocity of the market as a whole. Todays expected market time is 62 days, 19% lower than last year’s 77 days. At 62 days, all of Orange County it is a seller’s market. It is no longer a HOT seller’s market, below 60 days, as it was from the end of January to the middle of June of this year, but it is still hotter than July’s 63 day expected market time.
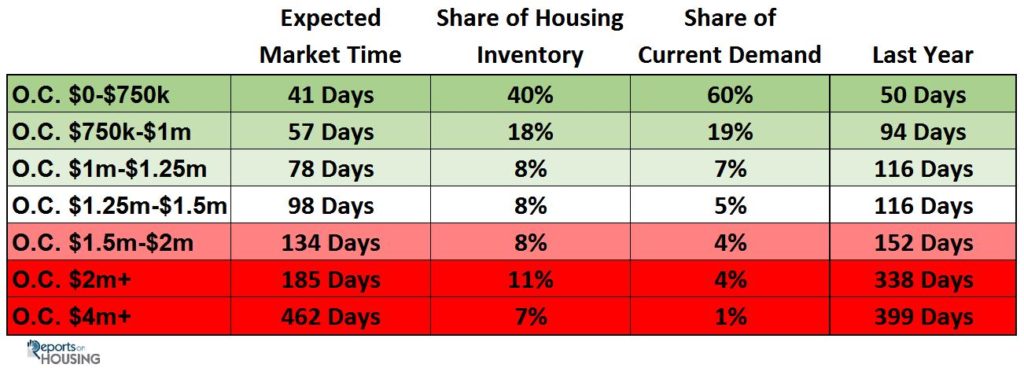
Everything priced below the $1 million mark, is flying off the shelves. The expected market time for homes priced below $500,000 is 34 days. Now that is hot! Above $1 million is a bit of different story, the higher the price, the slower the market. For homes priced above $4 million, the expected market time rises to 462 days.
From here, we can expect the active listing inventory to continue to fall throughout the remainder of 2017. Demand, in terms of new pending sales, will slowly but surely drop throughout the Autumn Market. It will then drop like a rock from Thanksgiving through the end of the year. With both the inventory and demand dropping, the expected market time will only rise slightly for the remainder of the year.
A warning for sellers: do not stretch the asking price much at all. Word from the real estate trenches indicates that many homeowners in the lower ranges are sitting on the market with very little activity and no offers to purchase because of price. In spite of the hotter real estate market, buyers are not willing to overpay for a property. As a seller, if you have been on the market for a while and the number of buyer showings has dropped considerably, the market is speaking to you. It is most likely the price. Homes that are priced well, taking into consideration condition, upgrades, and location, will attract offers to purchase.
A warning for buyers: do not expect the market dynamics to change much in the coming months. Even with a drop in buyer demand during the autumn and Holiday Markets, meaning less buyer competition, there will also be a drop in the number of homeowners placing their homes on the market. Many homeowners will opt to pull their homes off of the market now that both the Spring and Summer Markets are in the rearview mirror. Ultimately, there will be fewer choices. With a drop in both supply and demand at the same time, the expected market time will not fluctuate much.
Active Inventory: The active inventory dropped only slightly during the past couple of weeks.
The active listing inventory shed 15 homes in the past two weeks and now sits at 5,862. Fifteen homes may not be a lot, but it illustrates the direction that the active listing inventory will be heading for the remainder of the year: DOWN. It is the second lowest level this century, trailing only 2012. Typically, the inventory peaks around mid-August, but this year it peaked in mid-July.
Last year at this time, there were 7,267 homes on the market, 1,405 additional homes or 24% more than today.

Demand: Demand decreased by 2% in the past couple of weeks.
Demand, the number of homes placed into escrow within the prior month, decreased by 65 pending sales, or 2%, in the past two-weeks and now totals 2,825. Demand is off the most in the lower end, homes priced below $750,000. Today, there are 39% fewer homes available below $500,000 compared last year at this time and demand is off by 20%. Obviously, there is plenty of pent up demand and this data point would be through the roof if there were more homes available. Demand is off by 7% for homes priced between $500,000 and $750,000 with 20% fewer homes on the market. Above $750,000, demand is stronger this year compared to last year despite fewer homes on the market.
Last year at this time, demand was at 2,843 pending sales, 18 more than today.
Luxury End: Luxury demand increased by 4% in the past couple of weeks and the inventory dropped by 3%.
In the past two weeks, demand for homes above $1.25 million increased from 369 to 385 pending sales, a 4% increase. The luxury home inventory decreased from 2,072 homes to 2,002, a 3% drop. As a result, the expected market time for all homes priced above $1.25 million dropped from 168 days to 156 days. The luxury inventory will continue to drop through the end of the year. Similarly, luxury demand will drop significantly through the end of the year, but it will bounce around a bit, typically increasing slightly in October.
For homes priced between $1.25 million and $1.5 million, the expected market time decreased from 110 to 98 days. For homes priced between $1.5 million and $2 million, the expected market time increased from 130 to 134 days. For homes priced between $2 million and $4 million, the expected market time decreased from 224 days to 185 days. In addition, for homes priced above $4 million, the expected market time decreased from 480 to 462 days. At 468 days, a seller would be looking at placing their home into escrow around the start of December 2018.
looking at placing their home into escrow around the start of December 2018.

Orange County Housing Market Summary:
• The active listing inventory decreased by 15 homes in the past couple of weeks, and now totals 5,862. The trend is down for the remainder of the year. Last year, there were 7,267 homes on the market, 1,405 more than today.
• There are 39% fewer homes on the market below $500,000 today compared to last year at this time and demand is down by 20%. Fewer and fewer homes and condominiums are now priced below $500,000. This price range is slowly disappearing.
• Demand, the number of pending sales over the prior month, decreased by 65 homes in the past couple of weeks, down 2%, and now totals 2,825. The average pending price is $866,086.
• The average list price for all of Orange County remained at $1.6 million. This number is high due to the mix of homes in the luxury ranges that sit on the market and do not move as quickly as the lower end.
• For homes priced below $750,000, the market is HOT with an expected market time of just 40 days. This range represents 40% of the active inventory and 60% of demand.
• For homes priced between $750,000 and $1 million, the expected market time is 57 days, a hot seller’s market (less than 60 days). This range represents 18% of the active inventory and 19% of demand.
• For homes priced between $1 million to $1.25 million, the expected market time is 78 days, a tepid seller’s market with very little appreciation.
• For luxury homes priced between $1.25 million and $1.5 million, the expected market time decreased from 110 days to 98. For homes priced between $1.5 million and $2 million, the expected market time increased from 130 to 134 days. For luxury homes priced between $2 million and $4 million, the expected market time dropped from 224 days to 185 days. For luxury homes priced above $4 million, the expected market time decreased from 480 to 462 days.
• The luxury end, all homes above $1.25 million, accounts for 34% of the inventory and only 14% of demand.
• The expected market time for all homes in Orange County increased in the past couple of weeks from 61 days to 62 days, a tepid seller’s market (60 to 90 days). From here, we can expect the market time to slowly rise as housing makes its way through the Autumn Market.
• Distressed homes, both short sales and foreclosures combined, make up only 1.4% of all listings and 2.7% of demand. There are only 30 foreclosures and 52 short sales available to purchase today in all of Orange County, that’s 82 total distressed homes on the active market, dropping by 6 in the past two weeks. Last year there were 136 total distressed sales, 66% more than today.
• There were 2,768 closed sales in July, a 14% drop over June 2017 and a 1.9% decrease over July 2016. The sales to list price ratio was 98.2% for all of Orange County. Foreclosures accounted for just 0.8% of all closed sales and short sales accounted for 0.8%. That means that 98.4% of all sales were good ol’ fashioned equity sellers.
Have a great week.
Sincerely,
Roy Hernandez
TNG Real Estate Consultants
Cell 949.922.3947
[gravityform id=”22″ title=”true” description=”true”]

Leave a Reply