As housing transitions into the Summer Market, there are more
For Sale signs while demand softens.
The Summer Shift: The annual tradition is no different in 2017, housing is shifting from the Spring Market to the Summer Market. It is the season for commencement speeches, diplomas, and caps thrown into the air to mark the end of a chapter and the beginning of something new. Similarly, this is the season where the robust, hot Spring Market comes to an end, making way for a different market, a new chapter in local real estate, the Summer Market.
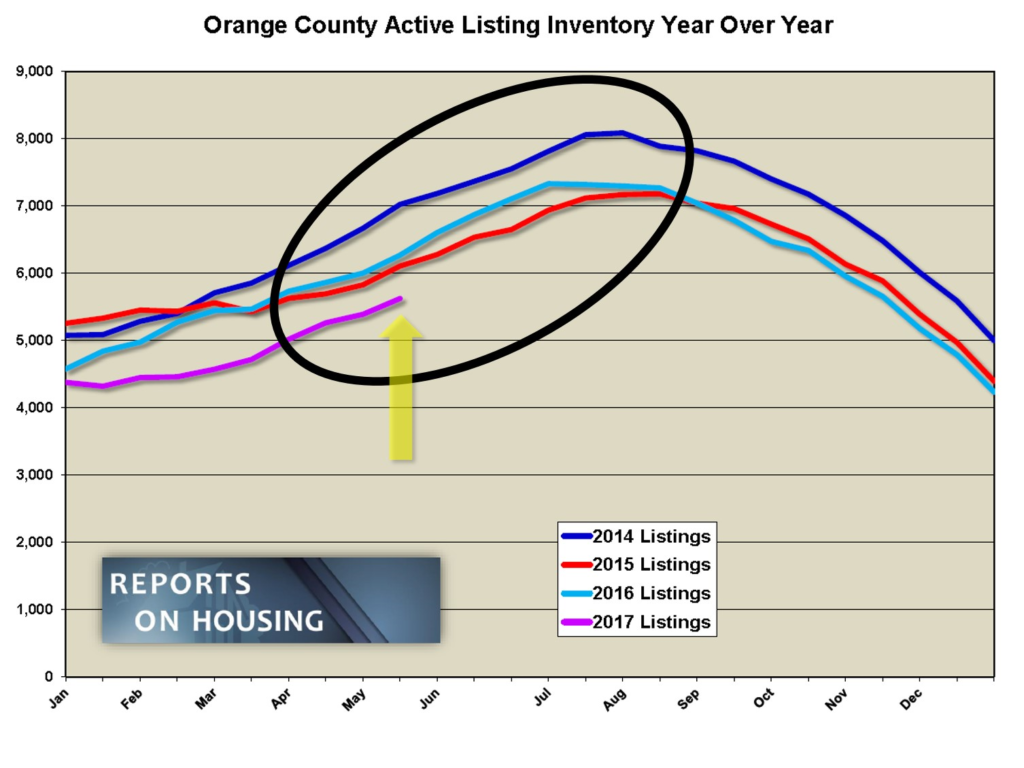
While the Summer Market may be the second busiest time of the year for real estate, sellers, buyers, and real estate professionals feel a palpable shift. The active listing inventory slowly and methodically grows from now through mid-August. At the same time, demand softens slightly from the peak of 2017, which occurred two weeks ago.
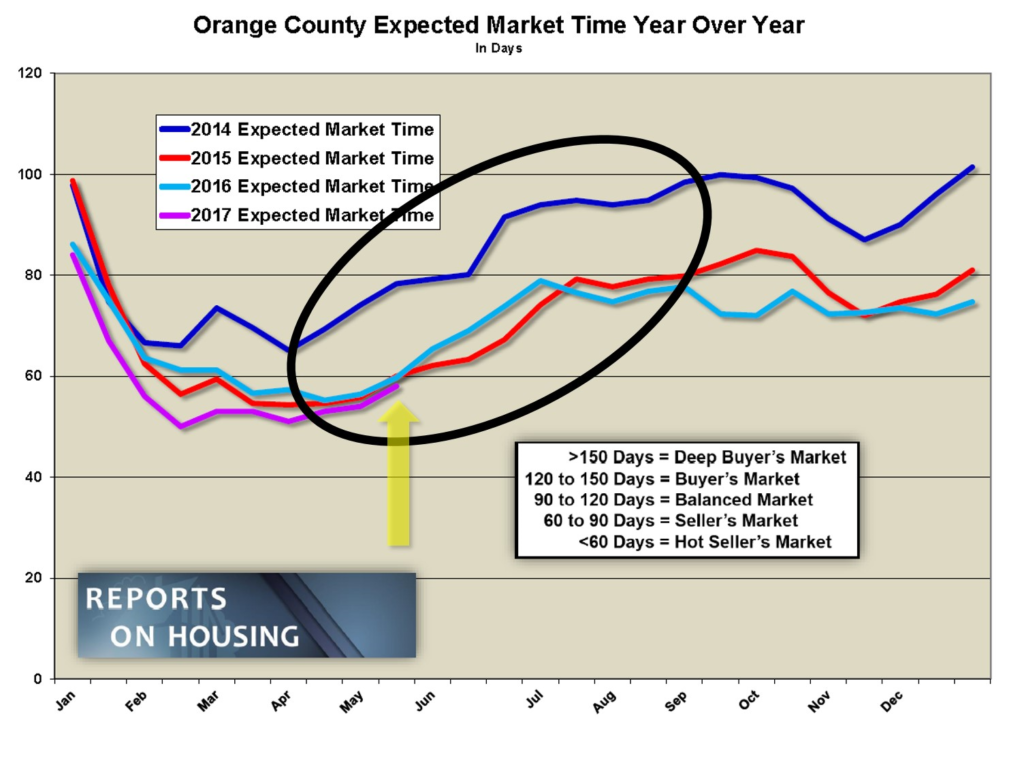
Many mistakenly think that right now is the absolute best time to come on the market. It is just not true. The best conditions actually occurred at the start of April when the expected market time hit a low. Since then, the expected market time has been slowly rising and will continue to rise from now through the 2017 peak in the active inventory, which typically occurs around mid-August.

This shift occurs because summer is full of distractions. From the beach, to the pool, to vacations, buyers’ attention is diverted a bit. Not to mention, the number one distraction, everybody’s kids are on summer break too. It’s just not as easy to see homes when the kids are not confined to their school classrooms.
Even though it will continue to be a seller’s market, overall housing is just about to move from a hot seller’s market to just a seller’s market. The stark difference in this market can be isolated to a bit less activity with not as many offers generated. This shift is much more dramatic in the higher price ranges, from $750,000 and up.
It may be a seller’s market, but sellers really need to approach pricing with extreme caution and care. For sellers who aggressively stretch their asking prices, they risk not being successful and missing both the Spring and Summer Markets. Arbitrarily picking a desired sales price and ignoring the closed and pending sales data is a recipe for disaster and a waste of valuable market time.
For example, a home that sold in December 2016 at $800,000 is not worth $900,000 today, over 12% higher. The market has been appreciating at about 5% annually. That means it takes 365 days for a home to appreciate 5%, not 3 months, not 6 months, not 9 months. It takes a year. On average in Orange County, that $800,000 home would be worth about $820,000, 6-months later. That is 2.5% more.
Additionally, it is worth mentioning that this simple example does not work for every property in every neighborhood. The appreciation rate varies from area to area, neighborhood to neighborhood, and sometimes from street to street. A professional REALTOR® can help dissect the recent closed and pending sales data to help establish the best price for success. Sellers absolutely should NOT utilize Zillow to price a home. Zillow admits it themselves, stating, “The Zestimate® is a starting point in determining a homes’ value and is not an official appraisal.” It is just an approximation and leads to inaccurate pricing. Nothing beats carefully looking at the comparable sales data and comparing the property size, bedrooms, bathrooms, location, amenities, upgrades, condition, lot size, and every other nuance that goes into the sale of a home.
The bottom line is this: the market is slowly cooling right now and the window of opportunity to find success prior to the kids going back to school at the end of August is beginning to close. Sellers find success through accurate pricing. Price out of bounds and risk losing valuable market time during the best time of the year to sell, the Spring and Summer Markets.
Active Inventory: The active inventory increased by 4% in the past couple of weeks.
The active listing inventory added an additional 236 homes in the past two-weeks, a 4% increase, and now sits at 5,623. Expect the inventory to continue to rise until it peaks around mid-August. Even though demand peaks in April to early-May, more homeowners come on the market in the month of June than any other time of the year. Since demand is not as strong, the active inventory grows. As more homes accumulate on the market, there is more seller competition.
Last year at this time, there were 6,267 homes on the market, 11% more than today.

Demand: Demand dropped by 3% in the past couple of weeks.Demand, the number of homes placed into escrow within the prior month, dropped by 98 pending sales in the past month, or 3%, and now totals 2,914. In both 2015 and 2016, demand eclipsed the 3,000 mark for two months, compared to just two-weeks this year. A major contributing factor to this year’s phenomenon is the lack of homes coming on the market in the lower ranges. In the last 30 days, there have been 21% fewer homes placed on the market below $500,000, and 11% fewer from $500,000 to $750,000.
We can expect demand to drop slightly from now through the upcoming summer months.
Last year at this time, there were 230 more pending sales totaling 3,144. Current demand is off by 7% compared to last year. The expected market time increased from 53 to 58 days in the past couple of weeks. Last year it was at 60 days, very similar to today.
Luxury End: Luxury demand dropped by 7% in the past couple of weeks while the inventory grew by 4%.
In the past two weeks, demand for homes above $1.25 million decreased from 398 to 369 pending sales, a 4% drop. The luxury home inventory increased from 1,887 homes to 1,965, up 4%. Similar to the rest of the market, demand is dropping for luxury homes while the luxury inventory continues to grow. There is already plenty of seller competition in the upper ranges.
For homes priced between $1.25 million and $1.5 million, the expected market time increased from 89 to 90 days. For homes priced between $1.5 million to $2 million, the expected market time increased from 134 to 162 days. In addition, for homes priced above $2 million, the expected market time increased from 198 days to 235 days. At 235 days, a seller would be looking at placing their home into escrow around mid-January of next year.

Orange County Housing Market Summary:
- The active listing inventory increased by 236 homes, or 4%, in the past couple of weeks, and now totals 5,623. Last year, there were 6,267 homes on the market, 644 more than today.There are 35% fewer homes on the market below $500,000 today compared to last year at this time and demand is down by 26%. Fewer and fewer homes and condominiums are now priced below $500,000. This price range is slowly disappearing.
- Demand, the number of pending sales over the prior month, dropped by 3% in the past couple of weeks, shedding 98 pending sales and now totals 2,914 , dropping below 3,000 a bit earlier than the past couple of years. The average pending price is $859,899.
- The average list price for all of Orange County remained at $1.6 million. This number is high due to the mix of homes in the luxury ranges that sit on the market and do not move as quickly as the lower end.
- For homes priced below $750,000, the market is HOT with an expected market time of just 37 days. This range represents 38% of the active inventory and 60% of demand.
- For homes priced between $750,000 and $1 million, the expected market time is 55 days, a hot seller’s market (less than 60 days). This range represents 19% of the active inventory and 20% of demand.
- For homes priced between $1 million to $1.25 million, the expected market time is at 65 days, a seller’s market.
- For luxury homes priced between $1.25 million and $1.5 million, the expected market time increased from 89 to 90 days. For homes priced between $1.5 million to $2 million, the expected market time increased from 134 to 162 days. For luxury homes priced above $2 million, the expected market time increased from 198 to 235 days.
- The luxury end, all homes above $1.25 million, accounts for 35% of the inventory and only 12% of demand.
- The expected market time for all homes in Orange County increased from 54 days to 58 in the past couple of weeks, a solid seller’s market (less than 60 days), but about to transition into a normal seller’s market (60 to 90 days). From here, we can expect the market time to slowly rise throughout the Spring and Summer Markets, moving from a deep seller’s market to a slight seller’s market.
- Distressed homes, both short sales and foreclosures combined, make up only 1.2% of all listings and 2.5% of demand. There are only 31 foreclosures and 37 short sales available to purchase today in all of Orange County, that’s 68 total distressed homes on the active market, 13 fewer than two weeks ago. Last year there were 141 total distressed sales, 107% more; that’s more than double.
- There were 2,663 closed sales in April, a 5% decrease over March 2017 and a 3% decreased over April 2016. The sales to list price ratio was 98.6% for all of Orange County. Foreclosures accounted for just 0.8% of all closed sales and short sales accounted for 1.4%. That means that nearly 98% of all sales were good ol’ fashioned equity sellers
Have a great week.
Roy A, Hernandez
TNG Real Estate Consultants
949.922.3947
RoyaltyAgent@Gmail.com
Photos and article courtesy of Steven Thomas.
[gravityform id=”22″ title=”true” description=”true”]


Leave a Reply