 Home prices continue upward. Equity home sales near 90 % all home sales.
LOS ANGELES (June 23) – Higher home values continued to fuel more equity home sales, which have made up more than 80 percent of all home sales for the past 11 consecutive months. Meanwhile, pending home sales fell in May as investors pulled out of the market due to higher home prices, the CALIFORNIA ASSOCIATION OF REALTORS® (C.A.R.) said today.
Distressed housing market data:
• The share of equity sales – or non-distressed property sales – rose further in May, rising to 89.2 percent, up from 88.4 percent in April. Equity sales have been rising steadily again since the beginning of this year. May marks the 11th straight month that equity sales have been more than 80 percent of total sales. Equity sales made up 78 percent of sales in May 2013.
• The combined share of all distressed property sales continued to decline in May, primarily due to a drop in REO sales. The share of distressed property sales was down from 11.6 percent in April to 10.8 percent in May. Distressed sales continued to be down by more than 50 percent from a year ago, when the share was 22 percent.
• Twenty-seven of the 41 reported counties showed a month-to-month decrease in the share of distressed sales, with 11 of the counties recording in the single-digits, including Alameda, Marin, San Diego, San Luis Obispo, San Mateo, and Santa Clara counties — all of which registered a share of five percent or less.
• Of the distressed properties, the share of short sales dropped to levels last observed in late 2007 at 5.6 percent, down from 5.9 percent in April. May’s figure was nearly a third of the 14 percent recorded in May 2013.
• The share of REO sales fell in May to 4.7 percent, down from 5.3 percent in April and from 7.6 percent in May 2013.
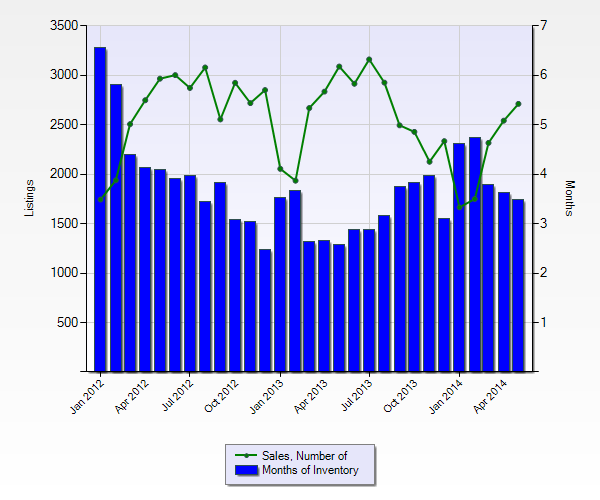
• The supply of inventory increased for equity sales and REO sales in May. The Unsold Inventory Index for equity sales edged up from 3.6 months in April to 3.7 months in May, and from 2.3 months in April to 2.4 months in May for REO sales. The supply of short sales dipped from 4.4 months in May to 4.3 months in April.
Pending home sales data:
• California pending home sales fell in May, with the Pending Home Sales Index (PHSI)* dropping 3.4 percent from a revised 114.1 in April to 110.1 in May, based on signed contracts.
• Pending sales were down 10.6 percent from the revised 123.2 index recorded in May 2013. The year-over-year decline in the PHSI was the first double-digit decline in three months. Pending home sales are forward-looking indicators of future home sales activity, providing information on the future direction of the market.
Charts (click link to open):
• Pending sales compared with closed sales.
• Historical trend in the share of equity sales compared with distressed sales.
• Closed housing sales in May by sales type (equity, distressed).
• Housing supply of REOs, short sales, and equity sales in May.
• A historical trend of REO, short sale, and equity sales housing supply.
• Year-to-year change in sales by property type.
[gravityform id=”13″ name=”Have a question or comment?”]

Leave a Reply