• Home
  • Buyers
    • Buyer’s Guide
    • For Buyers
    • Buyer Wish List
  • Sellers
    • Seller’s Guide
    • For Sellers
    • Property Updates
    • Marketing & Listing Proposal 2019
    • Prepare your house For Sale
    • How much is my house worth today?
  • City Info
    • Search All Towns USA
    • Community Reports
    • Anaheim
    • Brea
    • Orange
    • Fullerton
    • La Habra
    • Placentia
    • Santa Ana
    • Yorba Linda
  • News
  • Schools
  • Contact Us

Roy Hernandez Real Estate Services

Orange county real estate houses for sale

You are here: Home / Archives for Roy's Blog

OCounty Housing Report: Crazy Good Market… For Sellers

May 6, 2016 By Roy Hernandez Leave a Comment

The Orange County housing market is hot with the strongest demand
in three-and-a-half years.

happyface
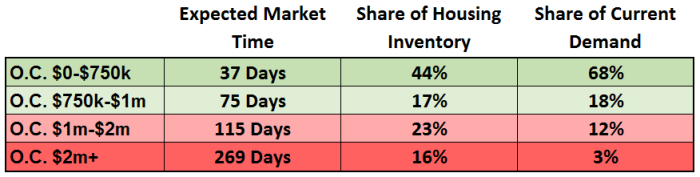
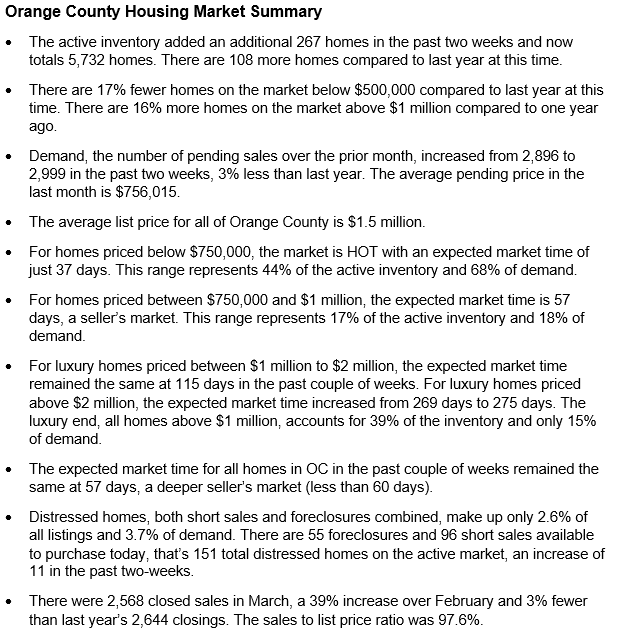
HOT Seller’s Market: Homes priced below $1 million are flying off the market.
The Orange County housing market is firing on all cylinders and sellers are in the driver’s seat. Multiple offers are back, values are on the rise, and the appraisal is quickly becoming the biggest obstacle in closing. Demand is stronger than one year ago and it appears as if this will be the best Spring Market since 2005.

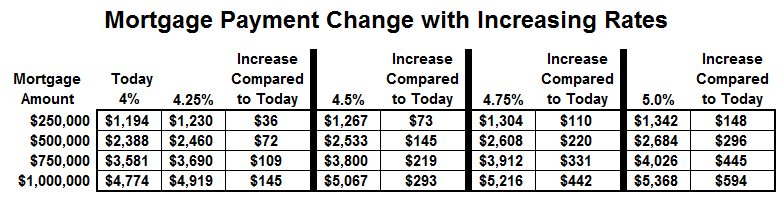
The Spring Market runs from March through mid-June. This is when more real estate activity takes place than any other time of the year. More buyers are bumping into each other in their quest to secure a home, and they are currently flooding the housing market. The historically low interest rates are adding fuel to the fire, allowing buyers to afford even more home.

OC YOYMistakenly, many believe that the Summer Market is the best time of the year to sell. It’s just not true. In mid-June, summer distractions creep into the housing market starting with graduation. Graduation, family vacations, the beach, the pool, hiking, and picnics slows the home buying process down a bit. Instead, that is when many of the pending transactions that were put together in the Spring Market close. As a result of all of the summer distractions, there is a cyclical downshift in buyer activity and demand.

For now, buyers below $1 million are experiencing an extremely challenging time securing a home. Below $750,000 is nothing short of crazy. There are homes that have the look and feel of an auction type of atmosphere. These new homes that hit the market cannot be shown until Saturday at a specific time that coincides with the REALTOR’s “mega open house.” Buyers are quite literally bumping into each other and everybody gets the sense that the bidding process is about to begin. The bids come in the form of multiple offers, the more offers secured, the better the price and terms for the seller. During the negotiating process, offers are pit against each other to drive prices even higher. The end result, only one buyer gets to purchase the home and often at a premium.

In order to find success, many buyers are getting creative. Family pictures combined with personal notes detailing why a house is the perfect place for them to call “home” are included with many offers to purchase. Hand delivered offers to the listing agent at their office, or even the open house, is another strategy. Finding out what the sellers want prior to writing an offer is very important. From a quick closing to renting back, getting the seller what they are looking for can really help secure the deal and enable a buyer to achieve success.

When the housing market tilts heavily in favor of the seller, it is an invitation for new sellers to overprice. Many sellers initially hit the market overconfident and overzealous and price their home off the radar screen. What sellers need to understand is that rapid appreciation is a thing of the past, dating back to when Orange County was underpriced and extremely affordable. In March 2012 the median sales price was $400,000. In March 2016, the median was $625,000, that’s a 56% increase in four years. Since homes are not rapidly appreciating today, the best strategy to employ for a seller is to price their home close to its Fair Market Value. As a result, the realistic value will generate multiple offers, which will ultimately allow them to get their price, and often even more. Values are slowly rising and continue to push the envelope, making the appraisal process a major hurdle to closing the sale.

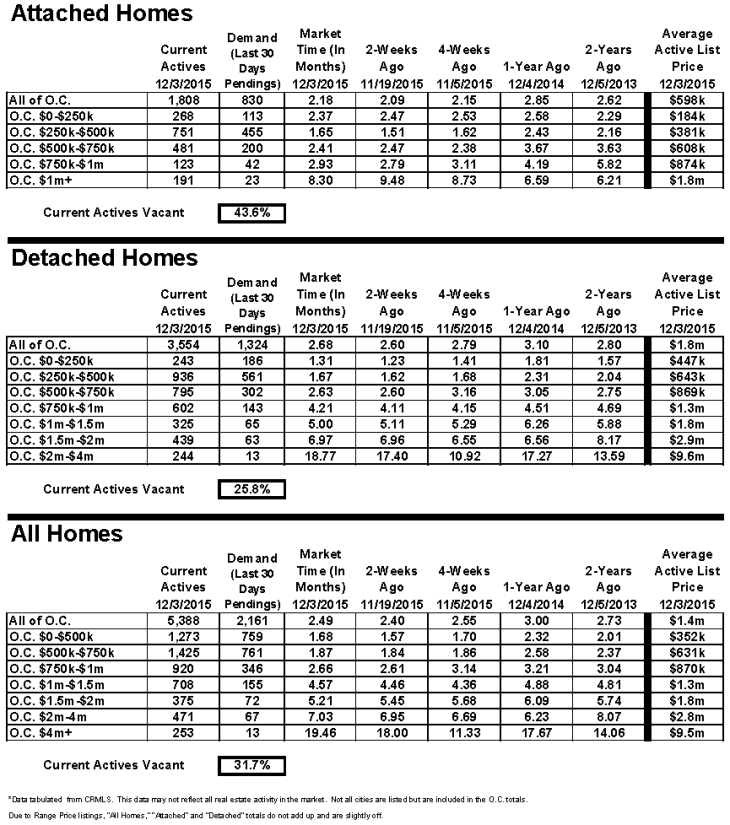
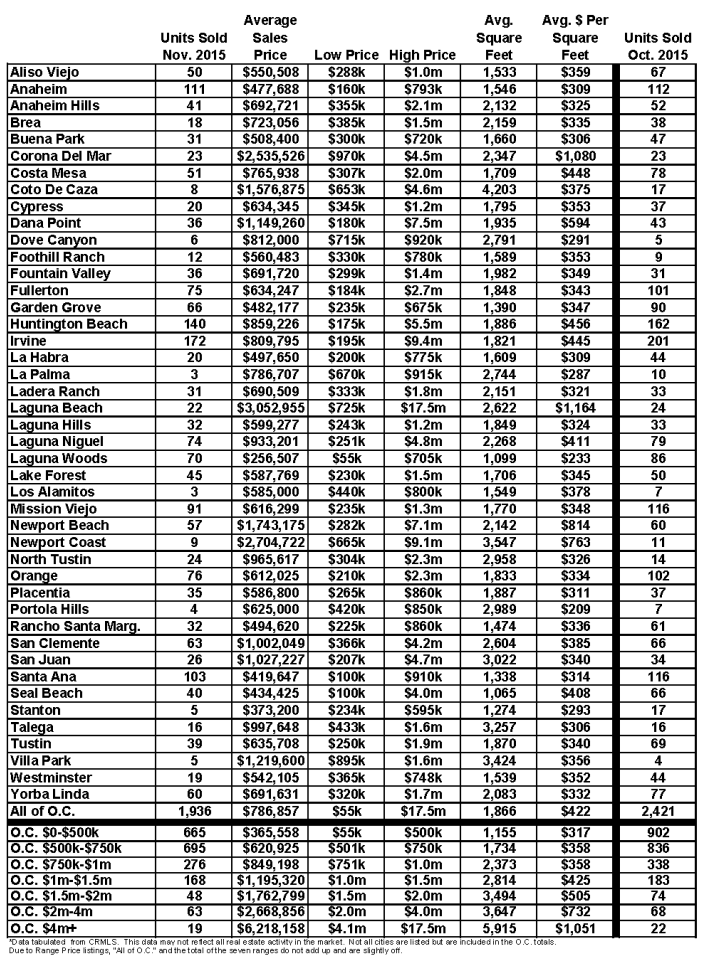
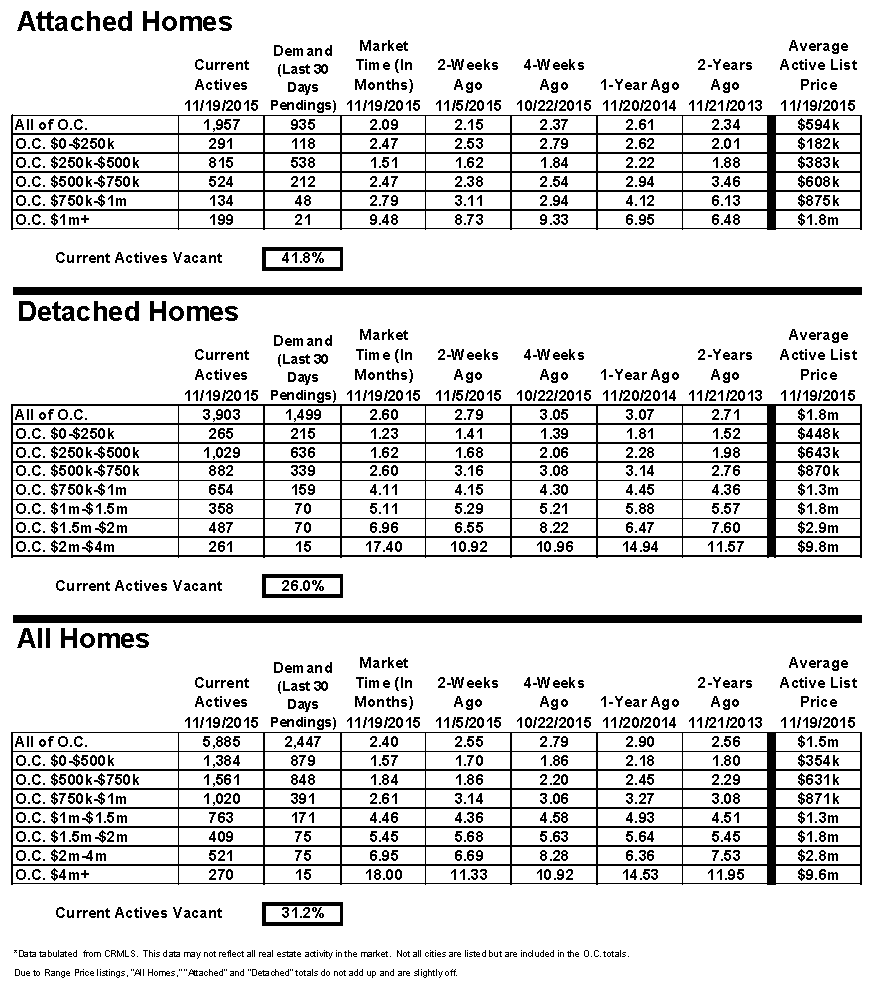
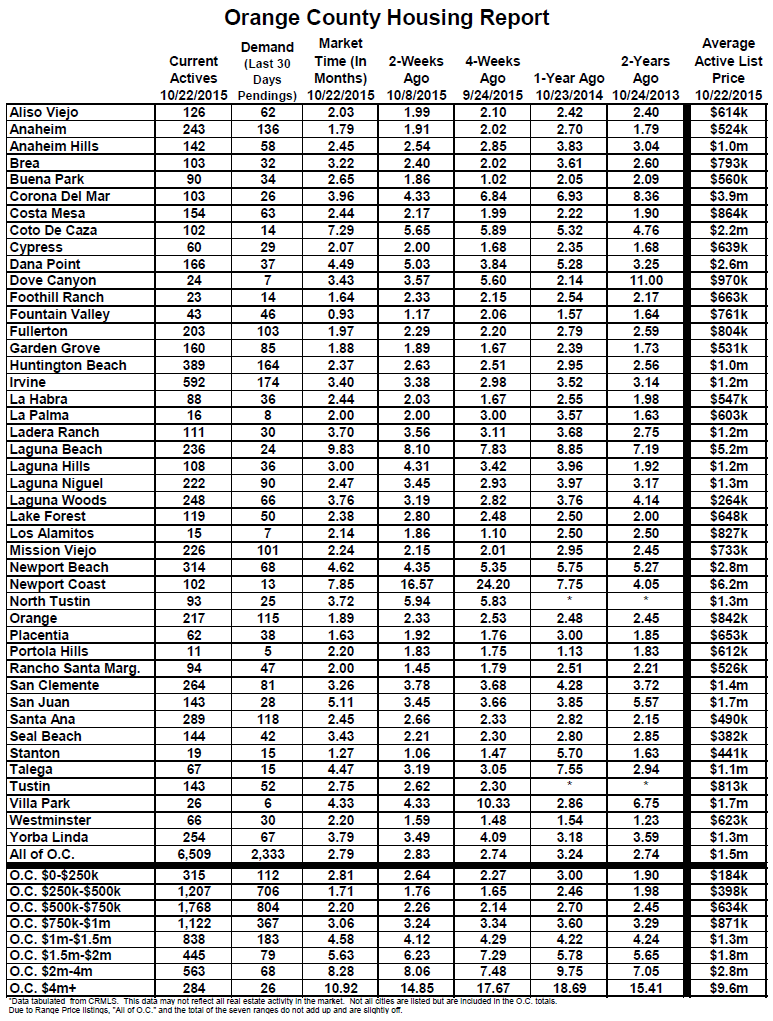
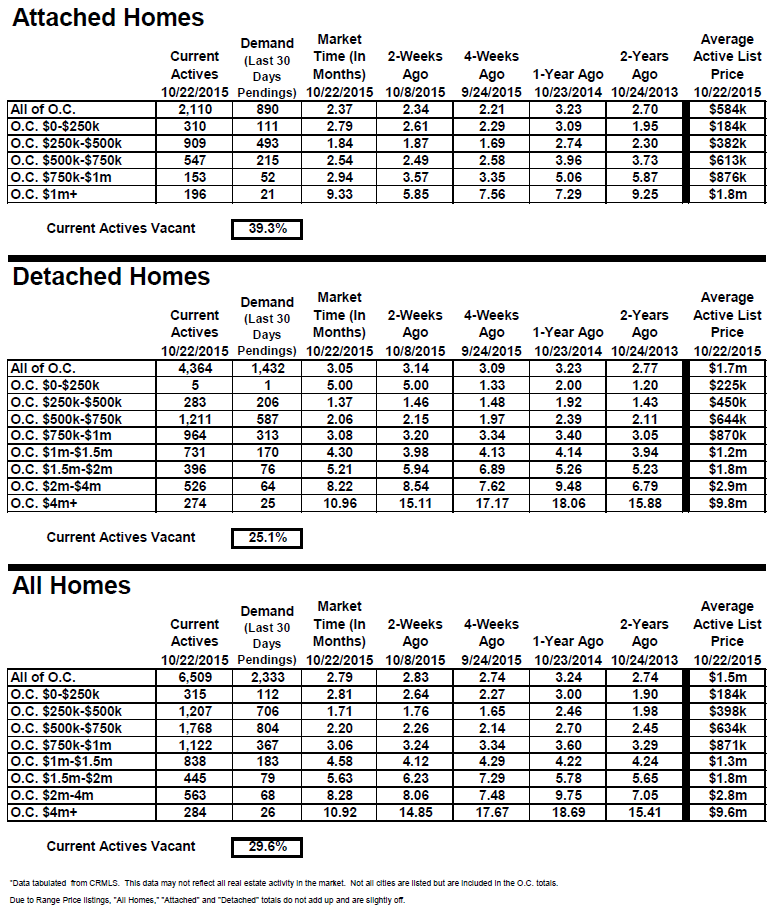
Is the luxury market hot too? In terms of demand, yes, it is stronger this year than one year ago today. In terms of supply, there’s a lot more homes in the luxury end compared to last year. The end result, it has a more sluggish feel to the market. From $1 million to $1.5 million, demand is up 19% and the inventory is up 22% compared to 2015. From $1.5 million to $2 million, demand is up only 2% and the inventory is up 24%. Above $2 million, demand is up 7% and the inventory is up 22%. So, above $1.5 million, demand may be up, but the extra inventory means many home sellers are having a tough time achieving success due to the increased competition. For these sellers it all boils down to price, condition, amenities, and location, and sellers only have control over price and condition.

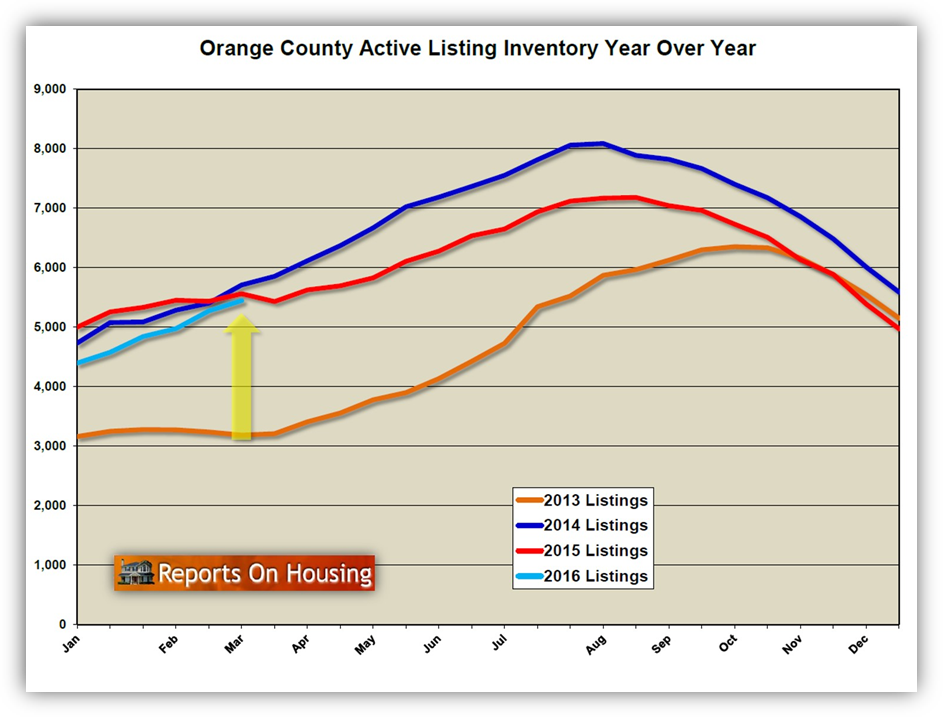
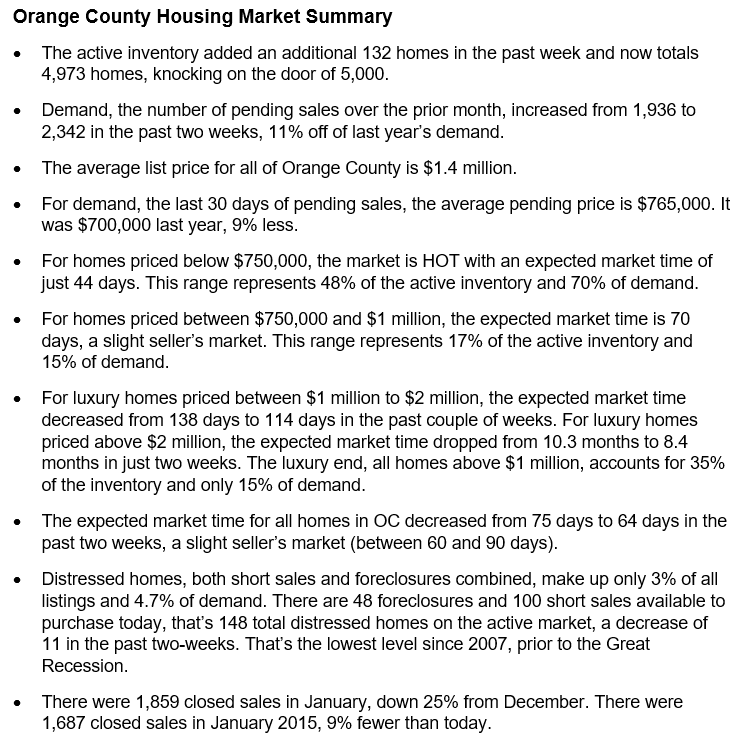
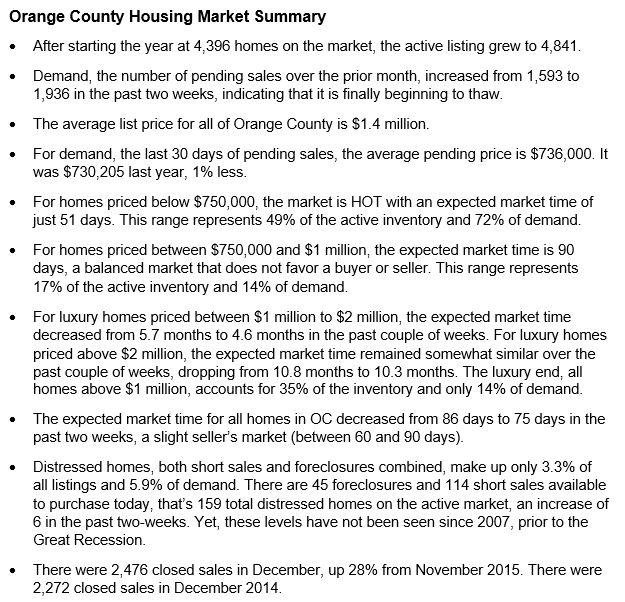
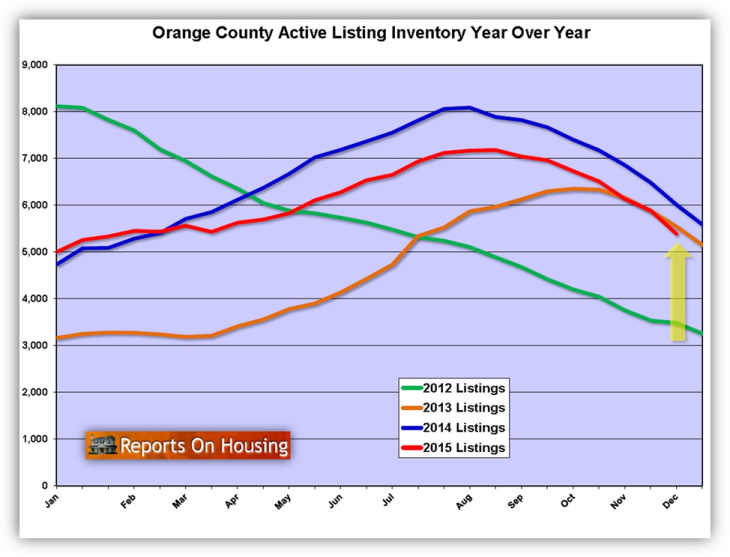
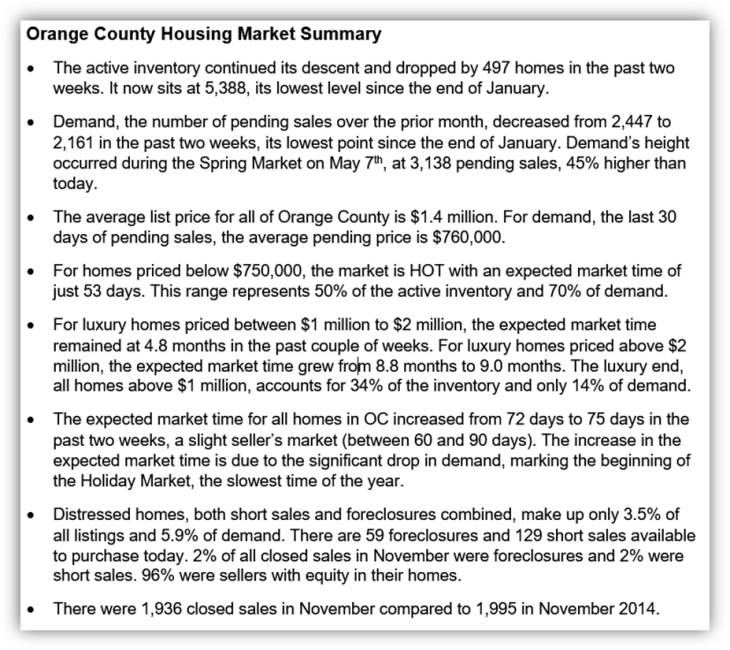
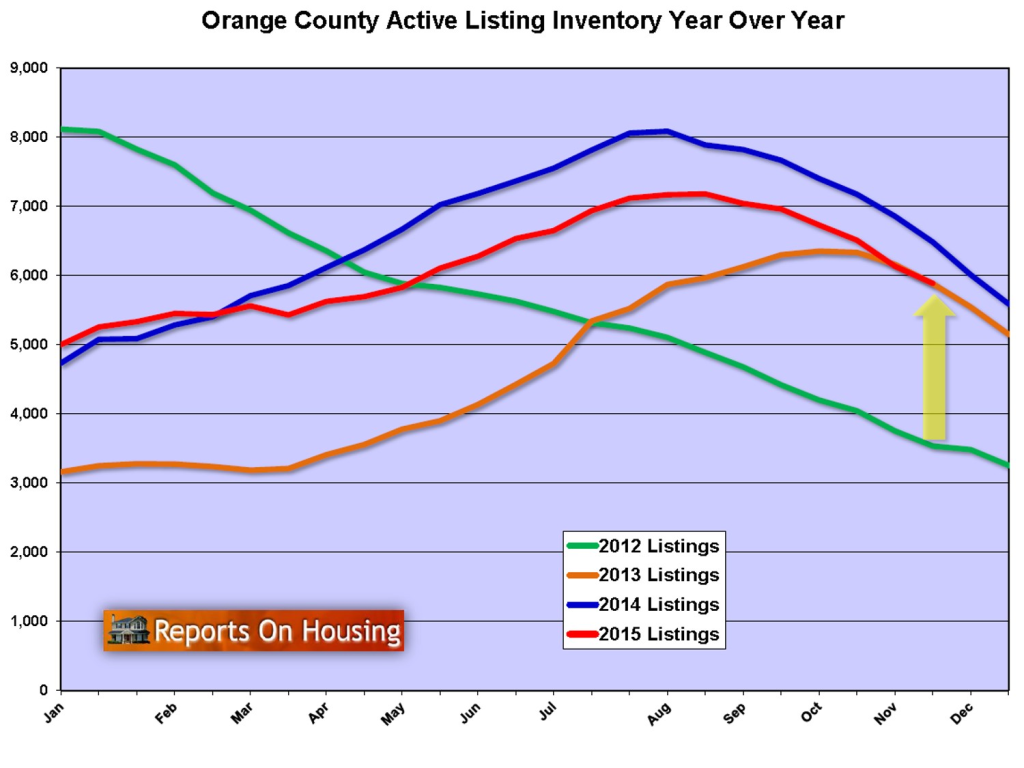
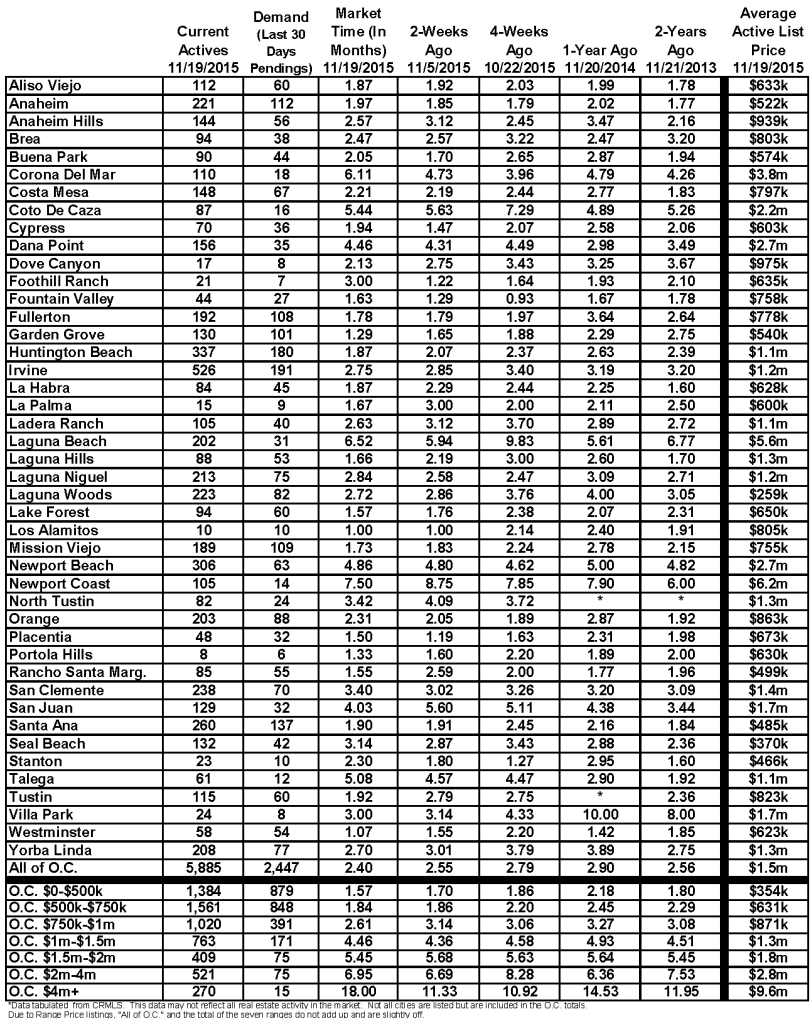
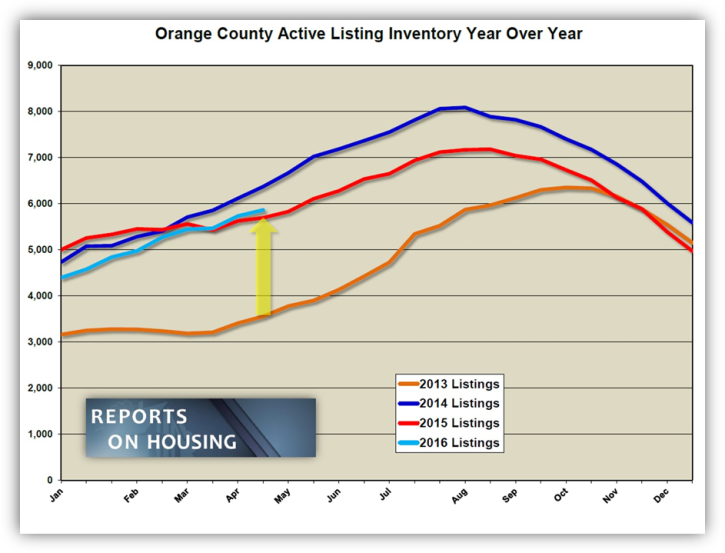
Active Inventory: The inventory increased by only 2% in the past two weeks.
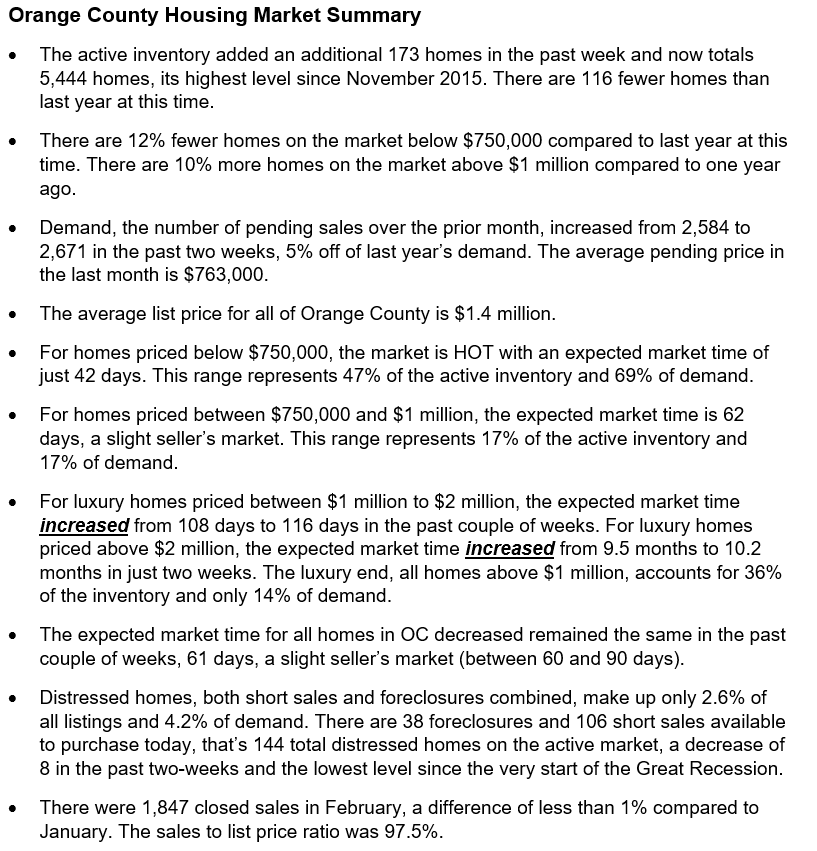
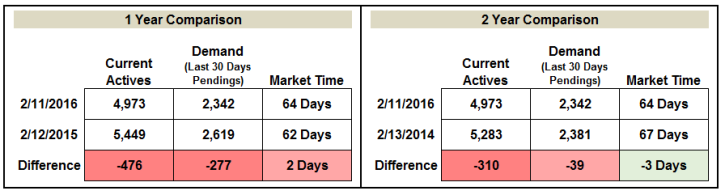
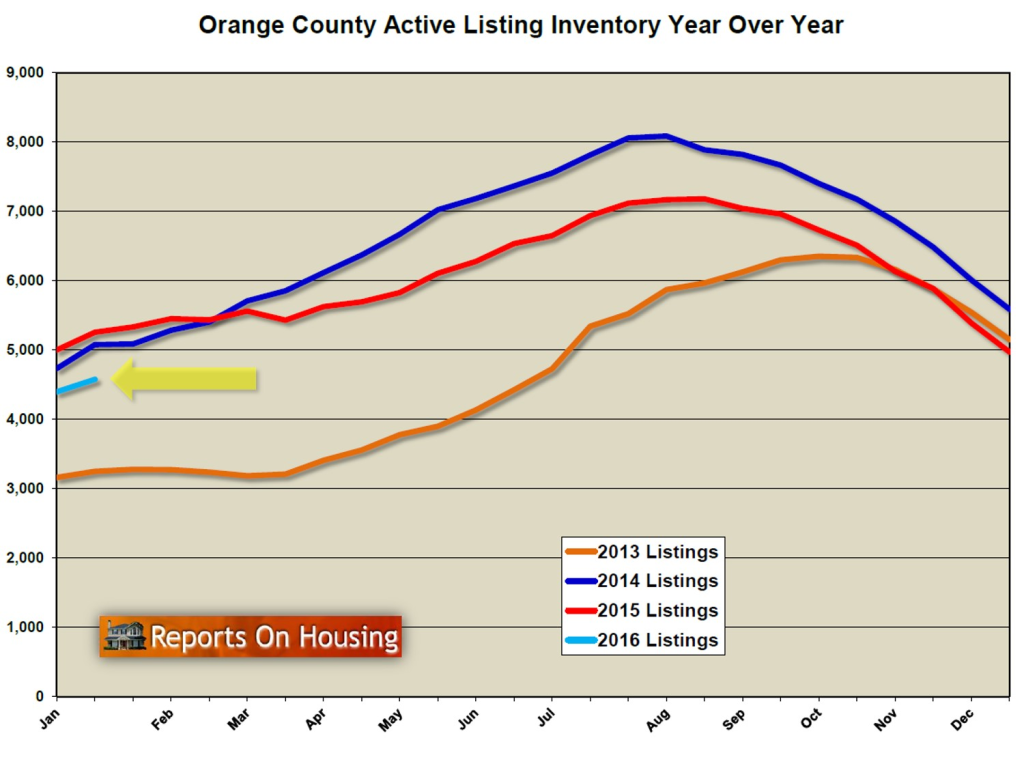
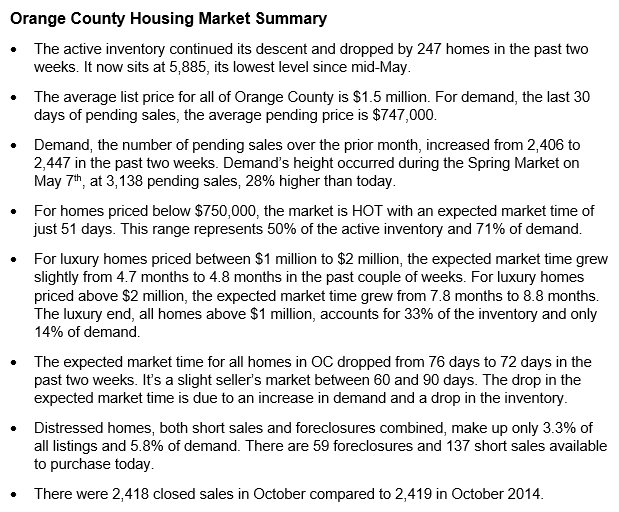
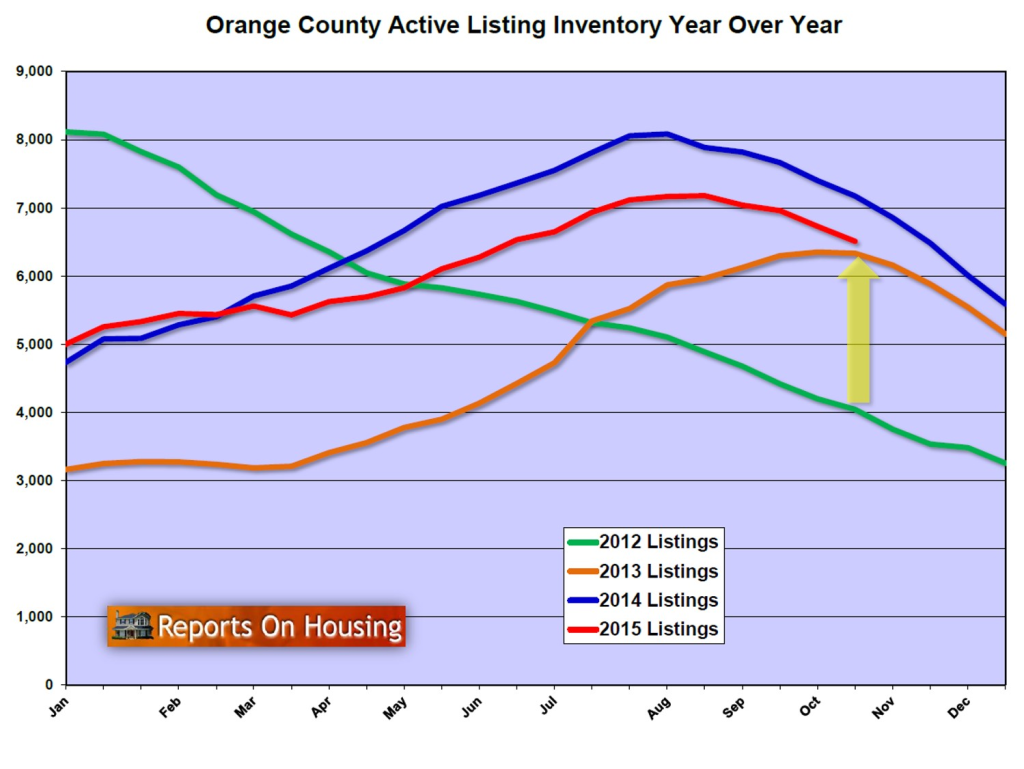
The active inventory increased by 130 homes in the past two weeks and now sits at 5,862. Every price range, except for homes priced below $500,000, experienced a slight increase. The inventory was growing at a much more rapid rate at the beginning of the year when the worldwide stock and financial markets were taking a beating, but as soon as stability was restored, so was Orange County housing demand. Higher demand means more pending sales. More pending sales means fewer active listings on the market. Now that demand is sizzling hot again, homes are not staying on the market and the inventory is not rising as fast. We can expect this trend to continue through mid-June, the start of the Summer Market. From there, the inventory will rise and peak in mid-August and reach levels similar to 2015.

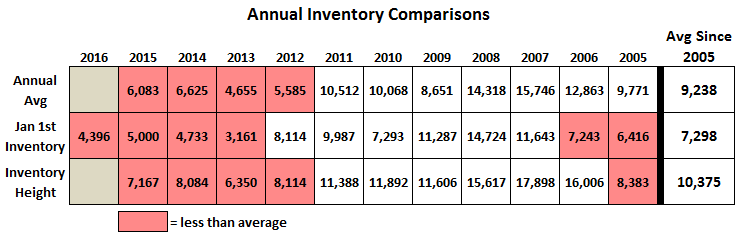
Last year there were 169 fewer homes on the market, 3% less. So far this year, the same number of homes have come on the market compared to one year ago today. Historically speaking, the inventory is well below the long term average of 9,238, an incredible 37% less. There just are not enough homes coming on the market compared to a decade ago.

OC listing inventory
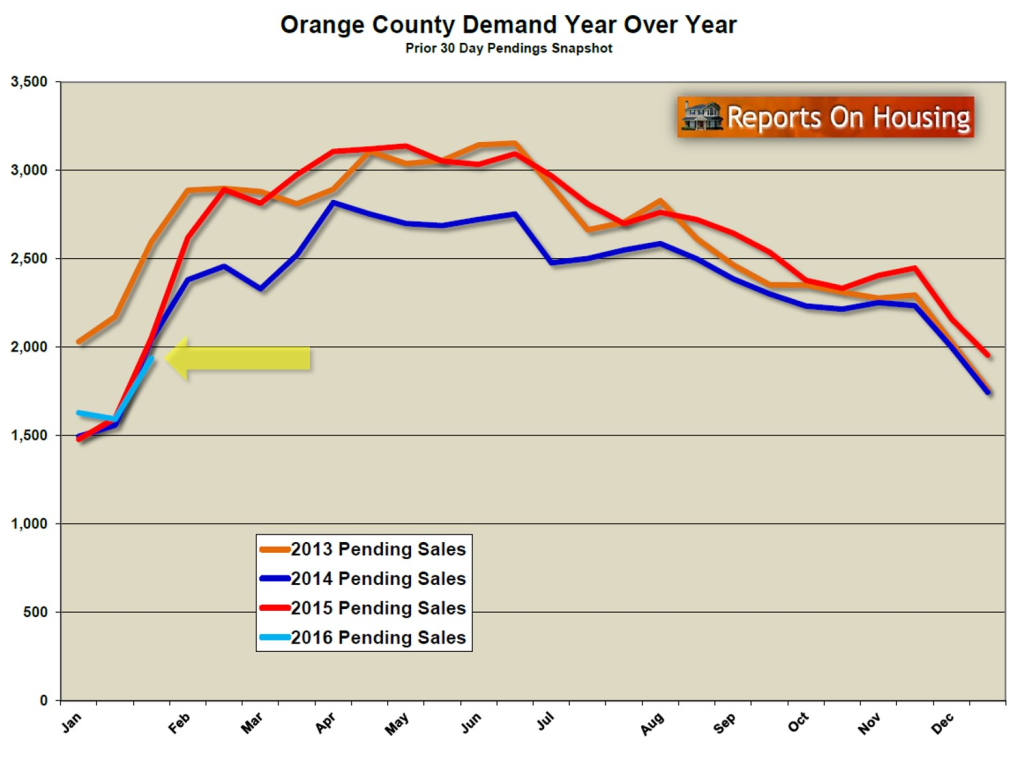
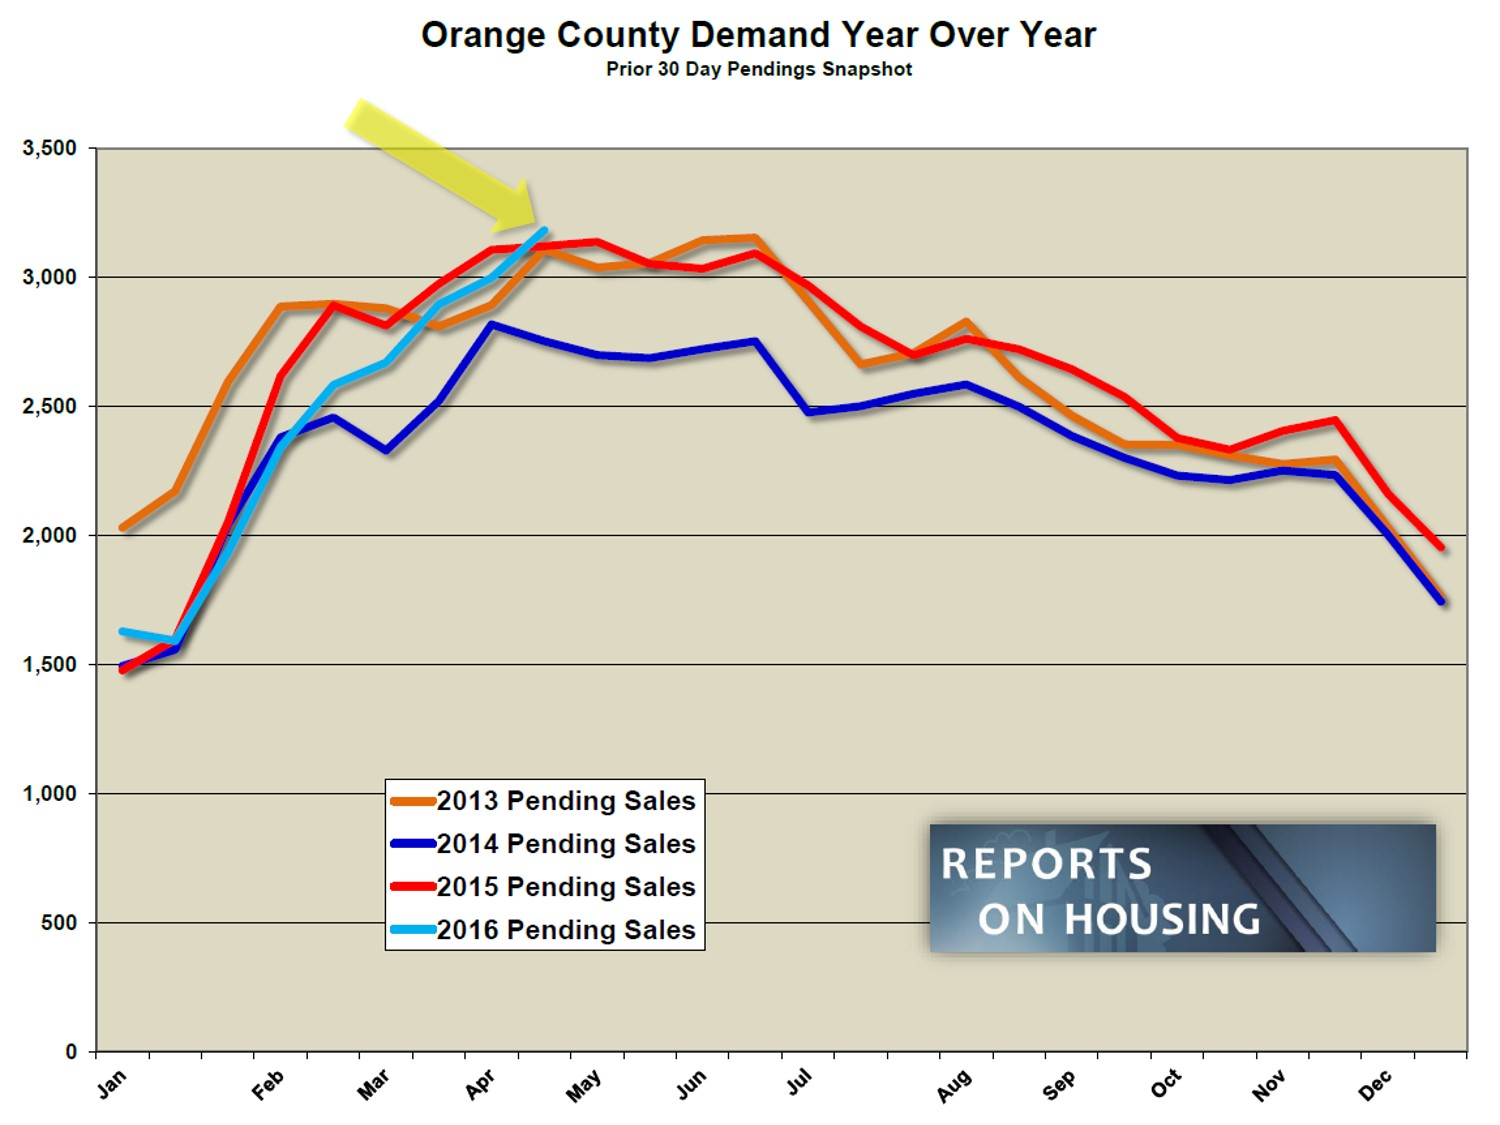
Demand: In the past two-weeks demand increased by 6%.
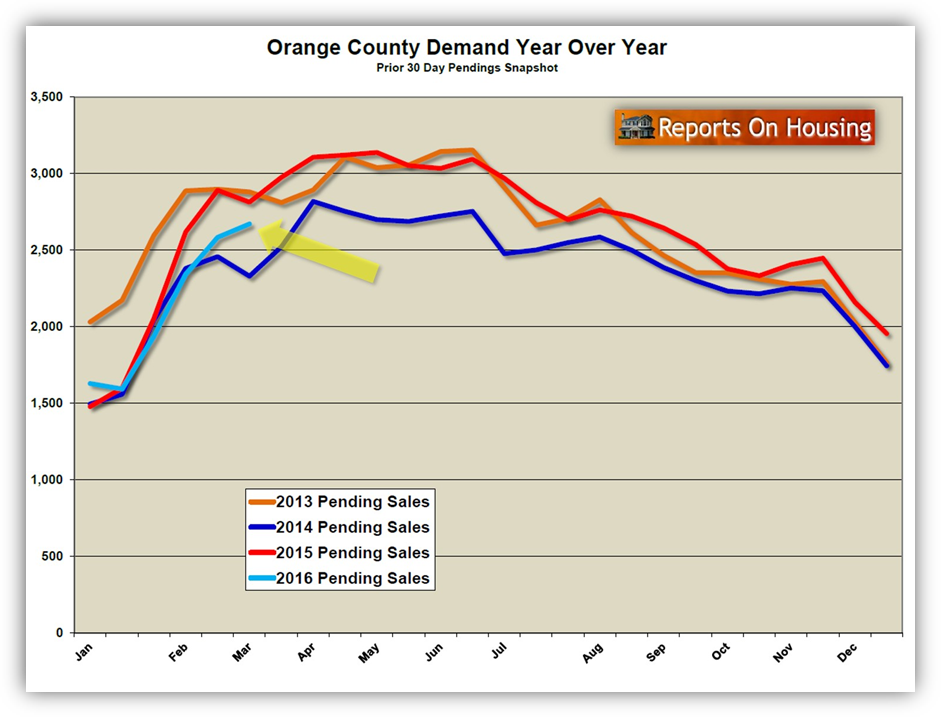
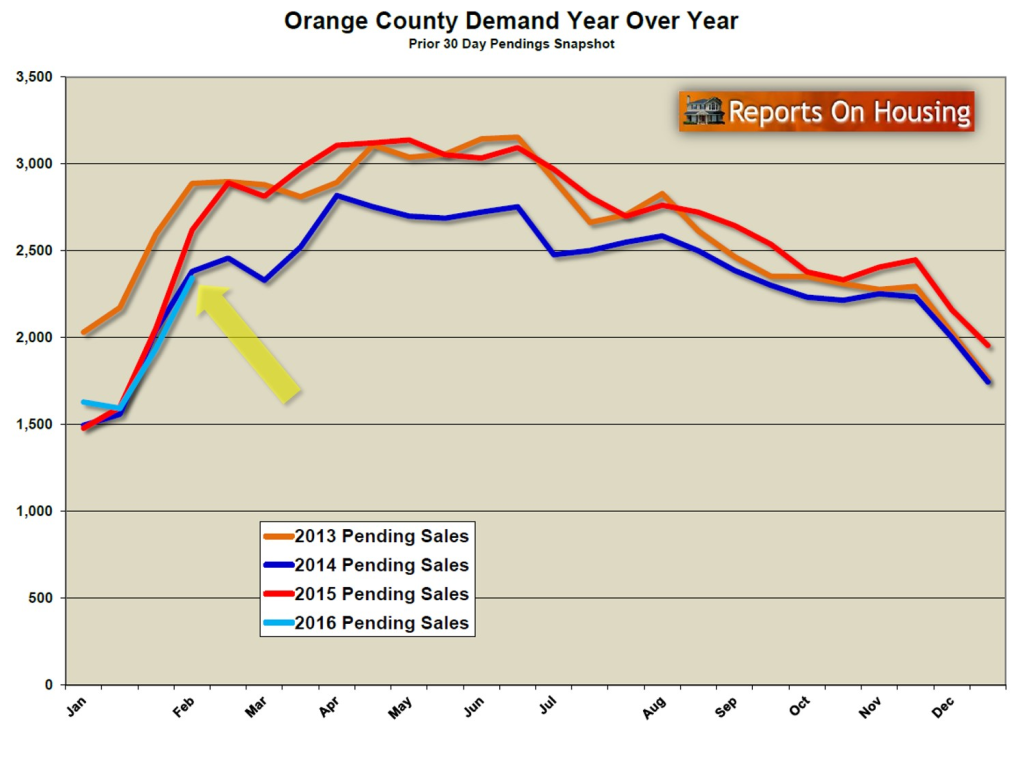
Demand, the number of new pending sales over the prior month, increased by 184 homes in the past two-weeks, and now totals 3,183, the highest level since October 2012 when there were a lot more short sales embedded in demand. Back then, many short sales never closed.

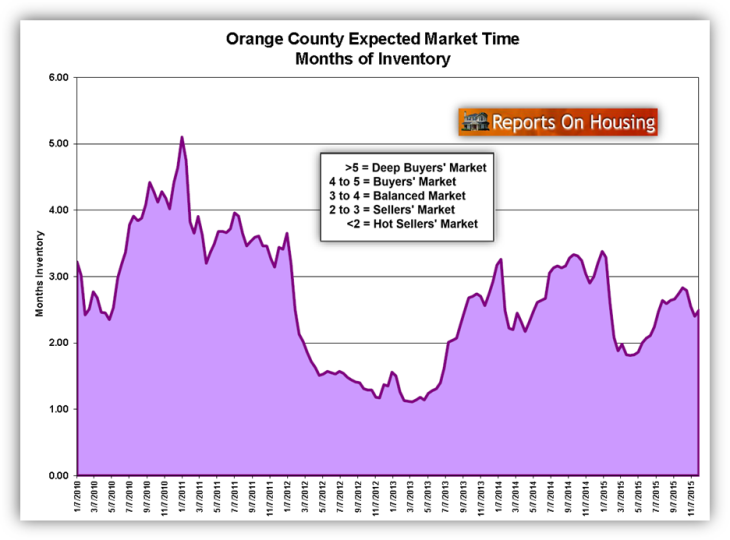
This Spring Market has the potential of being the strongest since 2005, prior to the Great Recession. High demand will equate to higher closed sales. The expected market time for all of Orange County is 55 days, identical to one year ago today.

Last year at this time, demand was at 3,121 pending sales, 62 fewer than today.

Summary:

summary2

Have a great week.

Sincerely,

Roy Hernandez
TNG Real Estate Consultants

Cell      949.922.3947

[gravityform id=”13″ title=”true” description=”true”]

Filed Under: Roy's Blog

OC Housing: OC Housing is Resilient

April 21, 2016 By Roy Hernandez Leave a Comment

flexing bicepsGood Afternoon!

After a shaky start, Orange County housing is proving to be
durable and strong.

A 1st Quarter Overview: The housing market continues to lean in favor of the seller. Due to worldwide stock market and economic turbulence, the Orange County housing market had a very sluggish start to the year. It seemed as if housing was lying face down in the dirt of the economic arena. The four-year hot seller’s market appeared to be bruised and battered and ready to begin tilting slowly to the buyer’s favor. In spite of very little supply, buyers were unilaterally balking at higher prices and were unwilling to stretch and pay a little bit more than the most recent sale. As a result, demand was off.

This is where the resilience of housing stepped in. The Orange County housing market got up from the dirt of the economic arena, brushed itself off, flexed its massive muscles, displaying its incredible strength and endurance, and surged forward. The hot market came back with a vengeance. Here’s a breakdown of the current OC housing trends:

• After a slow start, the active listing inventory is rising, but will remain well below the long term average. After starting the year with the second lowest inventory behind the extremely anemic 2013 housing market, it seemed as if there would not be enough homes to satiate buyers’ demand leftover from 2015. There were 7% fewer homes coming on the market through mid-February compared to the prior year. As the worldwide financial volatility found its footing, more homes started coming on the market. By the end of the first quarter, the exact same number of homes had come on the market as 2015. The slow start was replaced with an eagerness for homeowners to sell again, and they made up for lost time. The inventory had grown by 30% since ringing in the New Year. There are 2% more homes on the market today compared to last year due to the fact that demand is off a bit. Fewer new pending sales mean a higher inventory. The long term average inventory since 2005 is 9,238. The current active listing inventory is at 5,732, nearly 38% off the average. The trend is for the inventory to continue to grow at a slow methodical pace, peaking in mid-August right above the 7,000 home mark.

• Demand has regained its strength and looks a lot more like 2015. After an initial strong start, demand was 10% higher than the start to 2015, buyers quickly adjusted to the continuously streaming news of the stock market turbulence and demand slowed. It actually took an unprecedented drop after the first two weeks of January. As a result, after the first two months, demand was off by 11%. By the end of the first quarter, demand was only 3% less than 2015, and the Orange County housing market was humming along on all cylinders. The trend is for demand to remain strong through the second quarter, the hottest time of the year in terms of activity. It will then decelerate in July, like it cyclically does during every Summer Market.

• Every seller and buyer MUST understand that the lower the price range, the hotter the market; AND, the higher the price range, the slower the market. Not all price ranges behave the same. There are four vastly different market in Orange County. Below $750,000 is red hot. Price a home in good condition close to the Fair Market Value and it will generate multiple offers and will often sell at or above the asking price. With an expected market time of only 37 days, home values are climbing and it is a deep seller’s market. This range represents 44% of the active inventory and 68% of all demand. The second hottest price range, homes priced between $750,000 and $1 million has an expected market time of 75 days. This is a slight seller’s market, meaning that they are able to call the shots in negotiating a sale with a buyer, but values are not appreciating. Overprice in this range and sellers will sit. The third range, homes priced between $1 million and $2 million, is slow at 115 days, but will eventually move when priced accurately. The final price range, homes priced above $2 million, is extremely sluggish with an expected market time of 269 days. It accounts for 16% of the entire inventory, yet only 3% of demand. There just are too many sellers competing for a very small pool of buyers

expected market

• Closed sales are slightly up compared to 2015, but that trend changed in March. For the residential resale market, closed sales were up by 10% for January, up 5% in February, and down 5% in March. Overall, the first quarter saw closed sales up 3.3%. Demand has been less than 2015 levels since mid-January. In turn, that means that sales will be less as well. That trend will continue as long as demand trails the prior year. It is also important to note that distressed sales are way down. Foreclosures are down 14% and short sales are down 38% compared to 2015. Distressed seemingly vanished in 2014, and every year its impact has become less and less. This year is no exception. There were only 239 total distressed closed sales in the first quarter. Compare that to 336 last year, 416 in 2014, a staggering 1,573 in 2013, and a mind blowing 2,779 in 2012. Distressed has gone from 55% of the market in 2012 to just 5% today.

YOY comparisonsConclusion: from here, we can expect a market very similar to 2015 with slightly less demand, resulting in slightly fewer closed sales.

Active Inventory: The inventory increased by 5% in the past two weeks.
The active inventory increased by 267 homes in the past two weeks and now sits at 5,732. Every price range, except for homes priced below $500,000, experienced an increase.

The trend does not look like it is going to methodically increased like it did in 2014; instead, it looks like it will be a lot more sporadic like 2015. Ultimately, it will peak somewhere between 7,200 and 8,000 homes in mid-August. The eventual height depends upon future evolutions in the housing market.

Last year there were 108 fewer homes on the market, 2% less.

Demand: In the past two-weeks demand increased by 4%.
Demand, the number of new pending sales over the prior month, increased by 103 homes in the past two-weeks, and now totals 2,999, the highest level since June of last year. After an initial slow start to the year in terms of demand, it has recovered nicely and is beginning to follow closer to last year’s path. The expected market time for all of Orange County is 57 days.

Last year at this time demand was at 3,107 pending sales, 108 more than today, with an expected market time of 54 days.

Summary:

summary

Have a great week.

Sincerely,
Roy A. Hernandez
TNG Real Estate Consultants
Cell. 949.922.3947

[gravityform id=”22″ title=”true” description=”true”]

Filed Under: Roy's Blog

OC Housing Report: Housing is Springing Forward

April 8, 2016 By Roy Hernandez Leave a Comment

Spring forwardGood Afternoon!

The Spring Market has officially arrived and demand is poised to
continue its spring surge.

Spring Market: Over the next month, demand will rise to its highest levels of the year, where it will remain through the end of Spring.

The Orange County housing market did not look at all like 2015 after the first couple of months of the year. Instead, it looked a lot like it was going to be 2014, a year with a bit less demand and an inventory that continuously grew on the backs of overpriced homes. After ringing in the New Year, stocks were diving, prices at the gas pump were dropping to levels not seen in many years, and there was quite a bit of uncertainty in the air. All of these factors were a drag on the county’s housing market and there was a delay in the start to the Spring Market. Typically, the local market revs its monstrous engine right after the Super Bowl. Instead, demand was off by 11% throughout February. Where was housing heading? Would there be a correction in pricing? Is it still a good time to buy? Are we moving towards an economic slowdown?

The trend for this year is that housing is NOT headed for a correction; not anytime soon. Nationally, and especially locally, there has been a real supply issue that dates back to 2012. For this time of year, the average active inventory for Orange County since 2005 is 8,766 homes. Currently, we are at 5,444 homes. That means it is off by 38%. Since 2012, the average inventory for this time of year has been 5,349 homes. REALTORS® are not exaggerating when they state that there are not enough homes on the market. It is an absolute fact. With extremely favorable interest rates, there is tremendous demand. Strong demand coupled with a low supply means that the real estate market favors sellers, not buyers. The expected market time, the time it would take, on average, to list a home and place it under contract, is 61 days. The year started with an expected market time of 81 days and has been dropping ever since. In order for the market to shift in favor of buyers, the inventory would have to rise and demand would have to drop. The expected market time would have to exceed 120 days, double from where we are today. That is just not going to happen, not anytime soon.

active inventory YOYNow that the stock market has turned around, along with a rise in oil prices, it looks as if it is now business as usual for our economy and the local housing market. The anxious start to housing has shifted back to the fact that it is a good time to buy and buyers want to take advantage of the very low interest rate environment. Everybody gets it, as soon as the economy starts rolling along again, the Federal Reserve is ready to raise the short term interest rate again. Long term rates may not rise by much over the course of this year, but everybody knows that the low rates today cannot stick around forever. Naturally, buyers want to buy now while they know for certain that they will be able to cash in on a great rate. If interest rates were to jump from 4% to 5% (and, someday they will), the payment for January’s median priced home, $618,500, at 20% down would climb from $2,362 to $2,656, an increase of $294 per month, or $3,528 per year.

So, we are not headed for an economic disaster, no slowdown, no correction in housing, and interest rates remain low. As a result, housing is springing forward and demand is back. However, prices are not surging. Home prices are much higher than they were back in the beginning to 2012, the real start to the housing turnaround. Buyers do not have the stomach to pay much more than the last comparable sale. They want to pay the Fair Market Value for a home, which can be determined by carefully considering the most recent pending and closed sales. Prices may rise a bit during the first half of 2016 in the lower price ranges, below $750,000, but they are not going to surge.

Active Inventory: The inventory increased by 3% in the past two weeks.
The active inventory increased by 173 homes, or 3%, in the past two weeks and now sits at 5,444. After a very slow start to the year, when far fewer homes were coming on the market compared to 2015, the trend has reversed course. To date, there are only 45 fewer homes that have come on the market compared to last year. As a matter of fact, over the last month, 3% more homes came on the market. On January 1st, there were only 4,396 homes on the market. Since then, the inventory has added an additional 1,048 homes.

In order for the active inventory to grow, more homes have to come on the market than go off the market. The only way for a home to come off the market is for a home to move to pending status or for a seller to pull their home off the market and throw in the towel. With the beginning of the Spring Market, we know that sellers are not throwing in the towel. So, the increase in the inventory is indicative of an accumulation of homes that stay on the market without being able to procure an acceptable offer to purchase. The biggest culprit during the spring to successfully selling are the sheer number of overpriced homes. Most homeowners start off a bit overzealous and unrealistically price their homes. In time, the market illustrates that a reduction in price is necessary in order to find success.

Last year at this time the inventory totaled 5,560 homes, 116 more than today, with an expected market time of 1.98 months, or 59 days, a slight seller’s market. Today’s expected market time is at 2.04 months, or 61 days, still a slight seller’s market. A slight seller’s market means that there is not much price appreciation but sellers get to call more of the shots in terms of negotiating the finer details of a contract.

Demand: In the past two-weeks demand increased by 3%
Demand, the number of new pending sales over the prior month, increased by 87 homes in the past two-weeks, and now totals 2,671, the highest level since August of last year. Today’s demand is not as good as 2015, currently 5% less, but much better than 2014, 15% higher. The disparity from last year is growing smaller and is poised to continue to surge over the course of the next month. Last year at this time demand was at 2,813, that’s 142 additional pending sales. Two weeks ago the disparity was 307.

demand YOY

Summary:

summary

[gravityform id=”22″ title=”true” description=”true”]

Filed Under: Roy's Blog

OC Housing Report: Seller Drought

March 10, 2016 By Roy Hernandez Leave a Comment

binocularsFor the past seven years there have been significantly fewer sellers
coming on the market.

Not Enough Sellers: since 2009, fewer homeowners have been diving into real estate in spite of massive appreciation.Home values have risen tremendously since the beginning of 2012. With a return of equity, logically you would think that there would also be a return of the number of homeowners opting to sale. However, that has not been the case. It makes sense that fewer homeowners decided not to sell from 2008 through 2011. Those were the years that values took a pounding and homeowners witnessed the equity in their homes vanish. Since 2012, those same homeowners have watched their equity return; yet, 2012 through 2015 all posted the lowest number of homes to come on the market since the turn of this century. As a matter of fact, from 2000 through 2007, there were an average of 1,500 additional homes that popped on the market every single month compared to the past four years. That’s an additional 18,000 homes.

Based upon 2015 closed sales, the turnover rate for the Orange County housing stock is once every 23 years. That’s an improvement over 2014, once every 24 years, but not by much. The lowest turnover rates in the county can be found in Cypress, Fountain Valley, La Palma, and Westminster. These cities’ homes are turning over at a rate of once every 30 years or longer. There are a few exceptions; Aliso Viejo, Ladera Ranch, Laguna Woods, Los Alamitos, and Mission Viejo all have turnover rates of 15 years or less. But, based upon current trends, gone are the days of homeowners moving every 7 years.

closed sales

So, why aren’t homeowners moving like they did a decade ago? There are a number of factors that illustrate why they are staying put. The homeownership rate for 18 to 34 year olds has been dropping since reaching a height in 2005, and about a third of all millennials live with their parents. Ultimately, that delays would-be empty nesters from downsizing. Also, there aren’t as many new homes being built in Orange County, especially below the $1-million mark. This used to create a lot more real estate activity as many locals bought new, but had to sell their existing homes first. With the county running out of vacant land, this will be an ongoing issue.

Another factor that helps explain why homeowners are not moving as often as they used to is that owning a home long term and paying off the mortgage is now in vogue. The severity of the Great Recession rattled our collective psyche and people now look at home ownership a bit differently. As is typical in the Midwest, people want to hang onto their homes and dig in their roots.

One of the biggest factors, that is talked about in the real estate trenches on a daily basis, is that homeowners are afraid to sell their home only to turn around and find nothing available to buy. Essentially, the low inventory is preventing would be sellers from coming on the market, which only exasperates the problem. Yet, there are ways around this dilemma. A double move is a solution, where a homeowner sells their home, moves into a monthly rental, and then takes their time to isolate the most ideal home for their family. Moving companies work with the double move scenario often and can crate and store whatever will not be used at the short term rental. Another solution is for a seller to accept an offer to purchase with the condition that they are able to find a replacement property within a specific time period, 30-days being most common. If they are unable to find a replacement home within the given time period, then the contract is cancelled or additional time may be negotiated.

The current trend of an underwhelming annual inventory and a low housing turnover rate is not going to change anytime soon. With that knowledge, buyers and move-up (or move-down) sellers need to approach the market with realistic expectations and plan accordingly, utilizing the expertise of a professional REALTOR®.

Active Inventory: the inventory increased by 6% in the past two weeks.
The active inventory increased by 298 homes, or 6%, in the past two weeks and now sits at 5,271, the largest increase since May 2014. More homes are finally coming on the market after a lackluster start to 2016. 9% fewer homes entered the fray in January compared to 2015. More homes are coming on the market in February, so the annual difference to date is now only 3% fewer.

Last year at this time the inventory totaled 5,433 homes, 162 more than today, with an expected market time of 1.88 months, or 56 days, a seller’s market. Today’s expected market time is at 2.04 months, or 61 days, still a slight seller’s market. A slight seller’s market means that there is not much price appreciation but sellers get to call more of the shots in terms of negotiating the finer details of a contract.

Demand: in the past two-weeks demand increased by 10%.
Demand, the number of new pending sales over the prior month, increased by 242 homes in the past two-weeks, and now totals 2,584, the highest level since September of last year. Demand had looked a lot like 2014 for the first 6-weeks of the year, but broke away in the past couple of weeks. Demand is now 5% higher than two years ago, 126 additional pending sales.

However, today’s demand is nowhere close to 2015, 11% less than the 2,891 pending sales posted a year ago. That’s 307 fewer and has resulted in a noticeably different housing market. In spite of the low expected market time (the amount of time it takes to place a home listed today into escrow), buyers are not willing to budge much higher in price than the most recent comparable pending and closed sales, also known as the Fair Market Value. Thus far in 2016, homes that are not priced well are still realizing plenty of showing activity, but are not receiving any offers to purchase. Pricing is currently crucial in order to find success.

Expect demand to continue to increase methodically through March and then remain elevated through the end of Spring, mid-June.

OC demand YOY


Summary:

summary

Have a great week.

Sincerely,
Roy Hernandez
TNG Real Estate Consultants
Cell 949.922.3947

[gravityform id=”13″ title=”true” description=”true”]

Filed Under: Roy's Blog

OC Housing Report: 2015 it is NOT!

February 16, 2016 By Roy Hernandez Leave a Comment

2015 notEver since ringing in the New Year, 2016 has had its own look and
feel and it is not a repeat of last year.

Not 2015: Demand is off by 11% and the inventory is 9% less than last year.
This year’s housing market has its own unique look and feel. There are major differences from this time last year. The biggest glaring difference is that there are not enough homes on the market, 476 fewer. That would not be that big of an issue if we were anywhere close to the long term average inventory for Orange County, 9,238 homes; however, there are fewer than 5,000 homes on the market right now. The current trend of a very low inventory dates back to 2012, and todays even more anemic supply can truly be felt in the streets of the local housing market.

Another major difference is that demand is down significantly as well. Within the last month, there have been 277 fewer pending sales compared to 2015. Demand is actually much more similar to 2014 levels. Demand is increasing right now, just not at the incredible pace of one year ago when it just took off in February.


1&2 year comparison


So, where are we headed in 2016? It appears as if 2016 is looking a lot more like 2014 than 2015. One of the biggest reasons for the shift is the amount of uncertainty surrounding worldwide financial and stock markets, and the current volatility in Wall Street. Even the Federal Reserve seems a little less certain of their monetary policy than they were just a couple of months ago. That’s good news for interest rates. The chances that they will continue to increase the short term federal funds rate has dropped precipitously. As a matter of fact, interest rates have dropped well below 4% and are at unprecedented levels again.

If you are wondering how interest rates could drop so low right after the Federal Reserve increased the short term rate in December, it is because long term rates are not directly tied to the short term rate. Instead, they are tied to long term United States treasury bonds. With all of the worldwide financial uncertainty, everybody from around the world is turning to US treasury bonds as a safe haven. With so much money flooding to treasuries, the long term rate has dropped significantly. And, it doesn’t seem like things are going to be changing anytime soon either; so, the low interest rate environment looks like it will stick around for most of 2016. It is a great time to be a buyer, as these low rates make housing affordability a once in a lifetime opportunity. These rates are almost unbelievable in historical context.

For sellers, the uncertainty in the air means that they will not be able to get away with stretching the value of their home by pricing it much more than the Fair Market Value. This value can be determined by carefully analyzing the most recent sales and pending activity, taking into consideration location, condition, amenities, and upgrades.

In 2012 through 2013, sellers were able to aggressively stretch their price and, more often than not, they eventually got it. In 2014, buyers focused on the Fair Market Value and overpriced homes remained on the market without success until they reduced their asking prices more in alignment with their true value. The inventory grew on the backs of overpriced homes. But, in 2015, with stronger demand, the inventory remained low and sellers were able to get away with stretching the price again. They were not able to stretch as much as 2012 and 2013, but values were on the rise for the first half of the year. The second half of last year was more like 2014 and sellers needed to be priced right in order to find success. With demand more in line with two years ago, the current trend in the market indicates that this year will be a lot more like 2014.

The bottom line: Seller will find success when priced according to the Fair Market Value and buyers will still be diving into the housing market to take advantage of historically low interest rates.

Active Inventory: the inventory increased by only 3% as more homes are placed into escrow.
The active inventory increased by 132 homes, or 3%, in the past two weeks and now sits at 4,973, knocking on the door of 5,000 homes for the first time since the start of December. Thus far in 2016, fewer homes are coming on the market compared to the same time last year, 7% fewer. With fewer homes added to the inventory and more homes pulled off as they are placed into escrow, the inventory is not climbing as rapidly as it was during January, a cyclical phenomenon for February.

Last year at this time the inventory totaled 5,449 homes, 476 more than today, with an expected market time of 2.08 months, or 62 days, a slight seller’s market. Today’s expected market time is similar at 64 days, also a slight seller’s market. A slight seller’s market means that there is not much price appreciation but sellers get to call more of the shots in terms of negotiating the finer details of a contract.

Demand: in the past two-weeks demand jumped by 21%.
Demand, the number of new pending sales over the prior month, increased by 406 homes in the past two-weeks, and now totals 2,342, the most since November. That’s the largest increase since one year ago today, also a cyclical phenomenon that occurs in the month of February. During the same two-week period in 2015, demand actually increased by 566 pending sales and it totaled 2,619, or 12% more than today.

Today’s demand looks a lot more like 2014 when it reached 2,381 pending sales, just 39 more than today.

Expect demand to continue to increase methodically through March and then remain elevated through the end of Spring, mid-June

OC demand YOY


Summary:summary

Have a great week.

Sincerely,
Roy Hernandez
TNG Real Estate Consultants
949-922-3947
RoyaltyAgent@Gmail.com

Filed Under: Roy's Blog

OC Housing Report: Housing Has Awakened

February 9, 2016 By Roy Hernandez Leave a Comment

sunriseWith holiday distractions behind us, the Orange County housing Market has thawed and is beginning to rev its engine.

Housing Awakens: Inventory and demand improved dramatically in the past couple of weeks.

The stock market was taking a beating, driven by low oil prices and worldwide economic turmoil. The start of 2016 had everybody, including the Orange County housing market, on pins and needles. It seemed that the Holiday Market slowdown was not going to thaw like it typically does starting in mid-January.

Right after the Super Bowl’s clock winds down to zero, housing’s Spring Market begins. However, an important step needs to occur first, a cyclical thaw in January with an increase in the inventory and the number of homes coming on the market followed by an increase in demand. All of the holiday trappings of eggnog, family gatherings, the exchanging of gifts, and New Year’s resolutions were now in the rearview mirror. It was time to move on and for the Orange County housing market to awaken. But, it was not happening.

Both inventory and demand were off during the first couple weeks of the year. It appeared as if homeowners and buyers were all taking a wait and see attitude before jumping into the housing market. After the first three weeks of 2016, there were 8% fewer homes coming on the market compared to the start of last year. Demand actually dropped from the start of the New Year to the second week of January, something it had never done in the last decade.

Had the recent Fed hike in the short term rate slowed housing? Did the worldwide economic turmoil and the collapse in financial markets and Wall Street infect Orange County housing? It may have seemed like it, but it’s just not the case. As it turns out, interest rates are actually lower today than when the Federal Reserve hiked the short term rate for the first time in nine years in December. Long term interest rates for housing are not directly tied to the short term rate. Instead, those rates are more closely tied to treasury bonds. Because of all of the international turmoil, worldwide investors have flocked to treasury bonds as one of the safest investments on the globe. As a result, interest rates have actually dropped despite the Fed increasing the short term rate. However, if they continue to increase that rate, it will eventually spread to long term rates and have an effect on housing.

At first, it seemed as if the Orange County housing market’s slow start was tied to Wall Street and the worldwide economic turbulence. Regardless of the reason, it doesn’t matter now. The housing market has turned the corner and revved its powerful engine. In the past two weeks, demand jumped 22% with more buyers and sellers signing on the bottom line. The active inventory has been climbing as well, despite more pending transactions (when homes are changed to pending, they no longer count as part of the active listing total). More homeowners are taking advantage of the low, anemic inventory levels and entering the fray.

OC housing last two weeks

With interest rates so low, it is a great time to purchase and cash in on the historically low interest rates. The average interest rate since 1990 is 6.6% (since 1972 it is 8.5%). Today’s rates are unbelievably low. And, it looks as if the Federal Reserve has paused their rate hikes for now due to worldwide economic instability. So, it appears as if these low rates will be around for at least the first half of 2016, making it extremely advantageous to be a buyer. Despite Orange County home values inching its way closer to its prior peak set just prior to the Great Recession, the current interest rate environment has made homeownership much more affordable.

The monthly payment for the detached single family residence median sales price in December of $670,000, at today’s rate of 3.75% and 20% down, would be $2,482. When rates eventually rise to 4.75%, and they will (Freddie Mac forecasted 4.7% by the end of 2016), the payment would rise to $2,796 per month. That’s an increase of $314 per month or $3,768 per year. The bottom line: it makes sense to take advantage of today’s rates. Down the road, today’s buyers will be thrilled that they did.

For sellers in Orange County, the current inventory is extremely anemic and there are buyers waiting for new product to hit the market. The Spring Market officially begins next week after the Super Bowl and there is less competition today than there will be in the middle of spring. While April through May is typically the peak for the year in terms of demand, it is also a peak in the number of homes coming on the market, more competing homes. Waiting in anticipation of more appreciation makes sense in markets that are appreciating rapidly, but buyers today are not overly excited to stretch much more than the most recent sale. Instead, they are looking to purchase at or near a home’s Fair Market Value. Homes are no longer appreciating rapidly. The bottom line: it makes sense to take advantage of today’s low inventory and less competition.

Active Inventory:  the inventory has increased by 10% thus far this year.

The active inventory increased by 265 homes, or 6%, in the past two weeks and now sits at 4,841. That’s the largest increase in the inventory since July of last year. With interest rates being so low coupled with a low inventory, today’s hot demand may keep the inventory from growing rapidly until the Summer Market. That remains to be seen and depends upon how quickly seller adjust their prices closer to their Fair Market Values. Last year, 10% of the active inventory reduced the asking price each and every week. Overzealous sellers will have to reduce this year as well until they are in alignment with the Fair Market Value.

Last year at this time the inventory totaled 5,331 homes, 490 more than today, with an expected market time of 2.6 months, or 78 days, a slight seller’s market. Today’s expected market time is similar at 75 days, also a slight seller’s market. A slight seller’s market means that there is not much price appreciation but sellers get to call more of the shots in terms of negotiating the finer details of a contract.


Demand:  in the past two-weeks demand skyrocketed and increased by 22%.

Demand, the number of new pending sales over the prior month, increased by 343 homes in the past two-weeks, and now totals 1,936. That’s the largest increase since February of last year. During the same two-week period in 2015, demand actually increased by 454 pending sales and it totaled 2,053, or 6% more than today.

Expect demand to increase sharply through February and then remain elevated through mid-June, peaking sometime between April and May.

OC demand year over year

Summary:

summary

Have a great week.

Sincerely,
Roy Hernandez
TNG Real Estate Consultants

Cell     949.922.3947

[gravityform id=”13″ title=”true” description=”true”]


Filed Under: Roy's Blog

OC Housing Report: Where’s the Beef?

January 30, 2016 By Roy Hernandez Leave a Comment

wheres the beefLack of inventory has been the theme of the Orange County housing market for several years now.

Active Inventory: There just are not that many sellers on the market to start 2016. The Orange County housing market has a bad habit of starting the year off with an anemic inventory. This trend dates back to 2013 when almost nothing was on the market, only 3,196 homes. This year’s start is not quite that low, 4,396 homes, but it means that there are still not enough homes to satiate current demand. Today’s inventory is down 12% compared to just one year ago.

There’s definite pent up demand for homes, but just not enough inventory to match. Typically, that is a recipe for appreciation, low supply and high demand, but not in today’s market. Instead, buyers are approaching the housing market much more cautiously. They are very aware that homes have already appreciated considerably since 2012, so they are careful to not overpay. Today’s buyers are seeking the Fair Market Value for a home.

People often ask what is the Fair Market Value of a home and how does a homeowner ascertain that value for their home? It is the value of a home that is determined by factoring in the most recent comparable sales and pending activity. Active listings in the neighborhood are typically not factored into this value, as most active listings start off overpriced and a bit outside of the realm of reality. It’s not uncommon to find an entire neighborhood that is overpriced. It takes quite a bit of legwork and a seasoned professional to figure out the Fair Market Value of a home. The professional is NOT

annual inventory comparisons

Zillow.com or the plethora of other online valuation sites. These sites are so incredibly inaccurate. People used to think the earth was flat too. Today, people believe they can go to a website and it will tell them the value of their home. The professional that can help determine the true value of a home is a REALTOR®. They are able to factor in the condition, amenities, upgrades, and location of a home compared to the most recent closed and pending sales. Does a home have purple tile? Does it back to a busy street? Is there a partial view, panoramic view, or no view? Crown molding, plantation shutters, wood shutters, aluminum blinds, custom drapes, wainscoting, vinyl flooring, green carpet, 5×5 kitchen tiles, granite counters, high baseboards, custom paint, recently upgraded kitchen and/or baths, popcorn ceilings, vaulted ceilings, custom cabinets, outdoor pool and spa, outdoor fireplace, an entertainer’s backyard, garage storage, etcetera, all factor into the price of a home. There are details of a home that add to its value, just as there are features that subtract from value. The professional REALTOR® with the experience to weight everything will blow the socks off a home valuation site.

With buyers carefully approaching the market, it is extremely important that sellers price their homes as accurately as possible to properly take advantage of today’s lack of inventory. Homes that are priced right will fly off the market. The rest will sit until the price is brought more in alignment with the Fair Market Value. This is precisely why the active inventory will continue to grow from now through August; it will be on the backs of sellers who stretch their value.

Homeowners are foolish if they wait to place their home on the market in anticipation of cashing in on future appreciation. Since homes are not appreciating rapidly, waiting until later in the spring or next year will not be as beneficial as many people think. A great time to get a jump on the competition is actually now while the inventory is extremely low. The only caveat is that the home is priced appropriately.

The active inventory increased by 180 homes, or 4%, in the past two weeks and now sits at 4,576. It will continue to rise through August, but won’t really pick up steam until March.

Last year at this time the inventory totaled 5,255 homes, 679 more than today, with an expected market time of 3.29 months, or 99 days, a balanced market that does not favor a buyer or seller. In comparison, today’s expected market time is 2.87 months, or 86 days, an extremely slight seller’s market.

OC active inventoryDemand: with not that many homes on the market to start the year, demand remained flat.
Demand, the number of new pending sales over the prior month, dropped by 36 homes, or 2%, in the past two weeks, and now totals 1,593. It’s having a bit of trouble launching because of the lack of new, fresh inventory. For the first couple of weeks of the year, the number of homes to come on the market is down by 14%. More homes will come on the market now as everybody collectively shakes off the holiday fog and New Year’s resolutions drop by the wayside. Expect demand to increase sharply over the next couple of weeks as the number of homes coming on the market increases dramatically as well. This trend will catapult further right after the Super Bowl and start the transition to the most active season of the year, the Spring Market.

Last year at this time there were 6 more pending sales, nearly identical to today.

Summary:

summary


Have a great week.

Sincerely,
Roy Hernandez

[gravityform id=”13″ title=”true” description=”true”]


Filed Under: Roy's Blog

OC Housing Report: 1st Time Buyers…It’s not Fair!

December 11, 2015 By Roy Hernandez Leave a Comment

RON pouty graphic 121115
It is tough to be a first-time home buyer in a seller’s market and it is not really student debt that is preventing them from buying.

First Time Home Buyers: first-time home buyers are finding it very difficult to buy in Orange County and student debt is not their biggest hurdle. 

The lack of first-time home buyer activity has been unfairly blamed on strong growth in student debt over the past decade. For all buyers in Orange County, it has been tough to purchase for several years now. The main culprit, that it has been a seller’s market for the past four years. It all started back in 2012 and the same underlying market forces have been driving homebuyers nuts ever since.

The housing supply, the number of active homes on the market, has been well below the long-term average of 8,500 homes. The inventory peaked in mid-August this year, just shy of 7,200 homes. There are less than 5,400 homes on the market today. So, as far as choices are concerned, there are not that many homes for buyers to choose from.

On the other hand, demand has remained extremely strong, resulting in appreciation and restoring the overall health in the Orange County housing market. Due to strong demand coupled with an anemic active inventory, the expected market time has remained very low since 2012, tipping the market in favor of sellers ever since. The last time the tables were turned and buyers were in control of housing dates all the way back to January of 2011. A buyer’s market is when the expected market time, the average amount of time it takes to place a home on the market and into escrow, is more than four months. In 2011, it was the year of equilibrium, not favoring buyers or sellers, an expected market time between three and four months. Last year the housing market experienced equilibrium for the second half of the year, but not this year. It has been a seller’s market ever since the end of January of this year, and will probably remain one through the end of 2015. The expected market time today is at 2.49 months, or 75 days.

RON graphic 121115What does this mean for buyers? Most buyers do not get their first choice in a home. They need to write offer after offer, especially in the lower ranges, homes priced below $750,000. They need to sharpen their pencils and write offers at the Fair Market Value, or maybe even a bit higher if the price range and neighborhood warrant it. Buyers are simply not in the driver’s seat.

For first-time buyers, the challenges are even greater. Most first time buyers are looking for a home priced under $750,000. For homes priced below $500,000, the expected market time is at a very low 1.68 months, or 50 days, which is an even deeper seller’s market compared to the county as a whole. Between $500,000 and $750,000, the expected market time is at 1.87 months, or 56 days. When the expected market time is below two months, it is a “hot seller’s market” with a lot more competition to buy. Buyers are bumping into each other within these ranges, and the chances of dealing with multiple offers grows considerably.

The issue for most first-time buyers is that they lack a considerable down-payment. Most are looking in the lower ranges where it is still a “hot seller’s market” even in the month of December during the holiday, making it very difficult for first-timers to purchase. If a home is placed on the market in good condition and close to its Fair Market Value, it has a high likelihood of generating several offers. If a home produces three offers all with identical purchase prices where one is a first-time buyer with FHA, 3% down financing, another is at 10% down, and the final one provides 20% down financing, which one would you pick? In talking to agents across Orange County, unanimously, they all said the one with 20% down. This exercise is playing out every day, over and over again, in the lower ranges. First-time buyers have struggled to purchase and have had to write many offers in order to find success.

According to the California Association of REALTORS®, the long-term average for the share of first-time buyers is at 38%. In California, for the past three years it has been around 30%. The drop can be attributed to the continual seller’s market that has made it difficult to purchase for first-timers. Adding fuel to the fire is the lack of inventory and strong demand. Buyers who require low down payment financing often lose out in multiple offer situations, which is quite common in the lower price ranges where most firs-time buyers are looking.

Many believe that skyrocketing outstanding student debt is the reason for the drop in first-time buyer purchases. A study out of Dartmouth revealed that there is only an extremely slight decrease in the probability for someone with student loans to own a home versus someone who has no loans at all. Only if somebody does not graduate and has student debt does it then have a significant impact on owning a home.

The bottom line: there are plenty of first-time buyers who want to purchase; unfortunately, it is not easy to succeed. The secret sauce to success is plenty of patience, tenacity, ingenuity (family pictures and a letter to the seller will go a long way), and a very sharp pencil so that an offer to purchase will stand out. It may take writing many offers, but, eventually, victory will come, and the first-time buyer will be handed the keys to their share of the American dream.

Active Inventory: the inventory dropped by 8% in just two weeks.

The active inventory dropped by 497 homes, or 8%, in the past two weeks and now sits at 5,388. As we dive deeper into the Holiday Market, from Thanksgiving through the first few weeks of the New Year, the inventory drops to its lowest levels of the year. The absolute lowest point will occur on January 1st, and that will be after we drop below the 5,000 mark for the first time in a couple of year.

From there, expect the inventory to slowly rise, but by the end of January it will not even climb to where we are today. The inventory will not start to really rise until March.

Last year at this time the inventory totaled 6,010 homes, 622 more than today, with an expected market time of 3 months, or 90 days, a balanced market that does not favor a buyer or seller. In comparison, today’s expected market time is 75 days, a slight seller’s market. A slight seller’s market means that there is not much price appreciation.

Demand: the Holiday Markets are here and demand dropped substantially in the past couple of weeks.

Demand, the number of new pending sales over the prior month, plunged by 286 homes, or 12%, in the past two weeks, a strong signal that the Holiday Market has finally arrived. Buyers move from touring homes and writing offers to carving the turkey and shopping for holiday gifts. Demand will continue to drop through the end of the year and will not reverse course until mid-January. It will pick up steam right after Super Bowl Sunday.

Last year at this time there were 159 fewer pending sales, 8% less, totaling 2,002.

Summary:RON listing graphic 121115

RON summary 121115

Have a great week.

Roy A. Hernandez
TNG Real Estate Consultants
Cell 949-922-3947
RoyaltyAgent@Gmail.com

RON city numbers 121115

RON det att homes 121115

RON city solds 121115

[gravityform id=”13″ title=”true” description=”true”]

Filed Under: Roy's Blog

OC Housing Report: Right NOW!

November 24, 2015 By Roy Hernandez Leave a Comment

nowThe window of opportunity to take advantage of today’s historically low
interest rates is starting to close.

Interest Rates: after a couple of years of hinting at an eventual hike in rates, the Federal Reserve appears ready to make a move and raise the short term rate for the first time in nine years.
The Federal Reserve has been talking about raising the short term rate for a couple of years now. They kept kicking the proverbial can further down the road. It was supposed to be at the end of last year, then it was going to be the Spring of 2015, then in the Autumn, but they never pulled the trigger.

They have fooled just about everybody, from experts to the average person on the street. They seem to be talking out of both sides of their mouths. By mid-September of this year, the entire world had already factored in an increase in the short term rate. Instead, the Federal Reserve pointed out instability in China and other global markets and decided to maintain the status quo. The U.S. and world stock markets were already volatile and they responded negatively, dropping like a rock.

The following week, Janet Yellen, the Chair of the Federal Reserve, delivered a speech at the University of Massachusetts, and, out of character for the Fed, stated something of profound substance. She said that they were going to raise the rate by the end of the year as long as there weren’t any major changes to the economic landscape. The U.S. and world stock markets soared after her speech.

The reason the world sees a rise in our rates as something good is because it indicates that the Federal Reserve has faith in the U.S. economy. Their lack of action, especially in September, proved to be too much for the worldwide psyche. “Do they know something we don’t know?” They used to change the rate every other month and sometimes in between. It would go up, down, up, up, down, up, down, etcetera. It felt as if somebody was behind the wheel of the U.S. economic bus.

They did not pull the trigger in mid-October, but all indicators are “go” for mid-December. They are looking at a quarter of a percent hike in the short term rate. They are moving off of zero for the first time in seven years and getting back behind the wheel of the U.S. economic bus. The changes in the short term rate will not be as swift as prior Federal Reserve movements in the past, but nonetheless, they are moving in a positive direction. The short term rate effects savings

mortgage payment change

accounts, CD’s, commercial loans, and the rate at which banks borrow money from the Federal Bank window. As banks are charged more, long term rates, mortgages for homes, eventually go up as well.
An increase of a quarter of a point does not drastically change the monthly mortgage payment. But, as interest rates continue to climb, it certainly will put a dent in a borrower’s wallet. Remember, this is a monthly payment. So, for a $750,000 mortgage payment, the payment increases $109 per month every single month when the interest rate rises by just a quarter of a point. That’s an extra $1,308 per year. And, if the Fed continues to increase rates, we could find rates rising to 4.75% by the end of 2016. If that happens, the monthly mortgage payment for a $750,000 mortgage climbs by an extra $331 per month compared to today, or nearly $4,000 a year. That’s a lot of money. For a $500,000 mortgage at 4.75%, the monthly payment increases by $220 per month compared to today, or $2,640 per year. That’s a lot of money for the middle class family.

Keep in mind, historically speaking, 4.75% and 5% are not bad rates. We have just become accustom to ridiculously low rates complements of the Federal Reserve stimulating the U.S. economic engine for nearly a decade. The long term average for interest rates since 1972 is 8.5% and since 1990 it’s 6.6%. Eventually, down the road, interest rates will hit 5% and beyond, most likely topping at around 5.25%. For the $500,000 middle class borrower, a 5% interest rates means an extra $296 per month more compared to today. That’s $3,552 extra every single year, equivalent to a nice Hawaiian vacation every year for the term of the loan if a buyer acts NOW.

That’s right, NOW is the time to take advantage of today’s rock bottom rates. They might not be as low as they were earlier in the year, but the gift from the Federal Reserve is coming to an end.

Active Inventory: the inventory dropped by 10% in the past month.
In the past month, the active inventory dropped by 624 homes, or 10%, and now sits at 5,885. The Holiday Market has officially begun with Thanksgiving just a few days away. This is the slowest season for Orange County real estate. It’s when both supply, the active inventory, and demand, new escrows, drop to their lowest point of the year. The active inventory will continue to fall like a rock and will reach its lowest point of the year on December 31st. The season continues through Super Bowl Sunday, when Orange County begins its transition into the Spring Market.

Last year at this time the inventory totaled 6,484 homes, 599 more than today, with an expected market time of 2.9 months, or 87 days, nearly a balanced market that does not favor a buyer or seller. In comparison, today’s expected market time is 72 days, a slight seller’s market. A slight seller’s market means that there is not much price appreciation, but sellers are able to call more of the shots.

oc active listing inventory

Demand: Demand increased by 5% in the past month.
Demand, the number of new pending sales over the prior month, increased by 114 homes in the past month and now totals 2,447 pending homes. This bump in demand is typical for this time of the year as buyers are poised to take advantage of closing just prior to the New Year, an okay time to move a family while the kids are on Winter Break.

Now that we have entered the Holiday Market, demand will drop to its lowest level of the year by year’s end. It will start to rise at the start of 2016, but will not start its Spring Market surge until after Super Bowl weekend.

Last year at this time there were 213 fewer pending sales, 10% less, totaling 2,234.

Summary:

summary

Have a great week and have a terrific Thanksgiving!

Roy Hernandez

activity by city

attached detached stats

[gravityform id=”13″ title=”true” description=”true”]

Filed Under: Roy's Blog

OC Housing Report: Home Values Online… SCARY!

November 15, 2015 By Roy Hernandez Leave a Comment

eye openerToday’s sellers and buyers turn to the Internet to determine their
home’s value but forget to look at the fine print.


Online Home Valuation Tools: even though sellers and buyers turn to Internet sites to establish the property value of a home, it’s not even close to being accurate.
Everything is on the Internet. Recipes, comparison shopping, product ratings, music, dating, news, financial tips, economic analysis, entertainment, medical information, every business and every person is now on the Internet. With access to so much information, sellers and buyers now feel empowered with the ability to go online to learn as much about the home selling and home buying process as they wish. They can search to their hearts content as everything is now seemingly at their fingertips.

With this access comes the sense that sellers and buyers can control the process. They feel like they are in the driver’s seat. From home searches, to researching about the skillset of a REALTOR®, to looking at payment calculators, they can do a tremendous amount of research from the comfort of their homes. Zillow.com, REALTOR.com, Trulia.com, OCRegister.com, LATimes.com, YahooRealEstate.com, CNN.com, CNBC.com, etcetera, there are plenty of choices to learn more about the local, regional, and national real estate markets. There is a lot of great information available to real estate consumers to help in the process. Unfortunately, there is plenty of misinformation too.

The number one real estate website is Zillow.com. The main purpose of the site is to determine a home’s value, what they more affectionately refer to as a Zestimate®. Tragically, sellers and buyers rely on this site in their attempt to secure the precise value of a home. In looking up the Zestimate® of a home, sellers and buyers feel as if they are tapping into the most complex, accurate real estate program known to man. They enter in an address and Zillow® spits out the exact market value of a home. The problem is that it is NOT accurate at all. The site admits to its own shortcomings on the landing page and states, “Use the Zestimate® as a starting point in determining your current and future home value.” Not too many buyers are going to take the time to read that admission.

Good luck on finding the fine print too. You have to click on the term “Zestimate®,” even though it does not have a hyperlink, to learn more about what goes into their estimate. The fine print can be found by then clicking on “How Accurate is the Zestimate®?” Isolating Orange County is an even further challenge. The numbers illustrate exactly why sellers and buyers cannot rely on this tool to accurately hone in on a home’s value. It also illustrates why they should not even rely on the site as a “starting point” in the home valuation process.RE stats

Their numbers are eye opening. Shocking is an even better description when anybody with an economic background takes a closer look. Zestimate® accuracy is computed by comparing the actual final sales price of a home to the Zestimate® that the system originally came up with. In Orange County, only 41% of all closed sales were within 5% of the actual sales price. That means that 59% were off by more than 5%. For proper perspective, let’s take a look at a $700,000 Zestimate®. 5% of $700,000 is $35,000. It could be off by $35,000 more OR $35,000 less. That means that the actual value would be somewhere between $665,000 and $735,000, a $70,000 gap. That is just way too big of a spread to be able to pinpoint the value of a home.

67% of all closed sales were within 10% of the Zestimate®, meaning that 33%, one-third, is off by more than 10%. For the $700,000 Zestimate® example, the actual sales price would be somewhere between $630,000 and $770,000, a $140,000 gap. And, 86% of all closed sales were within 20% of the Zestimate®, meaning that 14% were off by more than 20%. That basically means that 1.4 out of 10 homes is off by a truckload. For the $700,000 Zestimate® example, the actual sales price would be somewhere between $560,000 and $840,000, a $280,000 gap.

To rely on Zillow® to determine the value of a home is nothing short of absurd. Sellers and buyers typically only bring up the Zestimate® when it works in their favor, about a 50/50 chance of that happening. If a home that should really sell for $650,000 has a Zestimate® at $700,000, the seller stubbornly ends up overpricing their home and is forced to reduce in order to find success. As a result of so many sellers feeling empowered to price based upon an online valuation tool, the housing market is plagued with overpriced homes.

There are thousands of valuation tools and some claim to be even more accurate than Zillow®, but that claim doesn’t really say much. Instead, buyers and sellers need to know the fine print which illustrates that while the Internet may be chalk fool of great real estate information, it just cannot be used to determine a home’s value. There are just too many factors that go into the price of each and every home. Every home is unique, making the valuation process too complex for even the most sophisticated computer program.

So, if you cannot use an online program to determine a home’s value, what is the best method in coming up with the Fair Market Value? Sellers and buyers need to turn to their REALTOR® to isolate the value, the true professional. They are able to help factor the condition, location, upgrades, and amenities of a home, something a computer program cannot duplicate.

Active Inventory: the inventory continued its descent, and shed another 3% in the past two weeks.
The Autumn Market inventory drop continued in the past couple of weeks, shedding 220 homes in the past two weeks and 450 over the past month. It now totals 6,509. This is the time of the year when not as many sellers are coming on the market and many unsuccessful sellers are throwing in the towel as we quickly approach the Holiday Market, now just a few weeks away. The inventory will continue its descent through the end of the year.

Last year at this time the inventory totaled 7,174 homes, 665 more than today, with an expected market time of 3.24 months, or 97 days. That’s 13 days longer than today.housing inventory YOY

Demand: Demand decreased by 2% in the past couple of weeks and 8% in the past month.
Demand, the number of new pending sales over the prior month, decreased by 45 homes in the past two weeks and now totals 2,333 homes. The drop is its lowest since the end of August. Demand stays fairly steady for the next month until it drops further as we dive into the Holiday Market. By the end of the year, it will drop to its lowest level, levels not seen since January.

Last year at this time there were 118 fewer pending sales, 5% less, totaling 2,215.

Distressed Breakdown: The distressed inventory increased by 23 homes in the past couple of weeks.
The distressed inventory, foreclosures and short sales combined, increased by 12%, or 23 homes, and now totals 208. Distressed homes are quickly reaching pre-Great Recession levels, a normal market.

In the past two weeks, the foreclosure inventory increased by 12 homes and now totals 62, Only 1% of the total active inventory is a foreclosure. The expected market time for foreclosures is 49 days. The short sale inventory increased by 11 homes in the past two weeks and now totals 146. The expected market time is 52 days. Short sales represent just 2% of the total active inventory.

Have a great week.

inventory stats

RE stats2

RE stats3

RE stats4

Filed Under: Roy's Blog

  • « Previous Page
  • 1
  • 2
  • 3
  • 4
  • 5
  • 6
  • …
  • 11
  • Next Page »

RoyaltyAgent@gmail.com

Search All Houses FOR SALE

Hot Bank Foreclosures & REO

Current Mortgage Rates

[mlrates state="CA" size="narrow"]

Fullerton Homes FOR SALE by Price

$300,000- $500,000
$500,000- $700,000
$700,000- $900,000
$900,000- $1,100,000
$1,100,000 and above

Fullerton Condos FOR SALE by Price

$200,000- $300,000
$300,00- $400,000
$400,000 and above

Our Coverage Areas

Brea Homes FOR SALE

Brea North Hills FOR SALE

Whittier Homes FOR SALE

Fullerton Homes FOR SALE

Placentia Homes FOR SALE

La Habra Homes FOR SALE

Yorba Linda Homes FOR SALE

Anaheim Homes FOR SALE

Brea Special Events

Community Reports

downtown brea

City Information


Brea

Yorba Linda

Placentia

Fullerton

La Habra

Tag Cloud

Anaheim Hills real estate for sale Anaheim house for sale bank owned Brea bank owned for sale Brea community info Brea foreclosure for sale Brea house for sale Brea houses for sale Brea real estate Brea real estate for sale Brea REO Brea REO for sale buyer real estate news foreclosure for sale Fullerton house FOR SALE Fullerton houses for sale Fullerton real estate Fullerton Real Estate For Sale fullerton resort living housing data housing market housing news la habra houses for sale La Habra real estate for sale north orange county for sale north orange county real estate orange county housing info orange county real estate Orange county real estate for sale orange county shadow inventory placentia condos for sale placentia for sale placentia homes for sale placentia houses for sale placentia real estate real estate information real estate news orange county REO for sale REO property for sale seller information whittier houses for sale Yorba Linda for sale Yorba Linda homes for sale yorba linda houses for sale Yorba Linda real estate for sale
The Virtual Realty Group
Roy Hernandez
cell/text (949) 922-3947
RoyaltyAgent @ gmail.com
RoyalAgent.net
BRE#01202958
  • Blog Page
  • I’d like to sell my house
  • About

Copyright © 2025 Website by The Burrell Group · Log in