• Home
  • Buyers
    • Buyer’s Guide
    • For Buyers
    • Buyer Wish List
  • Sellers
    • Seller’s Guide
    • For Sellers
    • Property Updates
    • Marketing & Listing Proposal 2019
    • Prepare your house For Sale
    • How much is my house worth today?
  • City Info
    • Search All Towns USA
    • Community Reports
    • Anaheim
    • Brea
    • Orange
    • Fullerton
    • La Habra
    • Placentia
    • Santa Ana
    • Yorba Linda
  • News
  • Schools
  • Contact Us

Roy Hernandez Real Estate Services

Orange county real estate houses for sale

You are here: Home / Archives for Roy's Blog

Don’t Sell Your Home “UGLY”

October 9, 2018 By Roy Hernandez Leave a Comment

Every where I turn these days I see signs or large billboards advertising selling your home for quick cash. The signs say, “sell your home UGLY” with the cartoonish Caveman. Often I think to myself, “why would anyone sell to these hawkish investors”? Whenever someone sells out of necessity or they need cash fast, do they ever get a fair price for their asset? For example, do you ever receive top dollar for anything sold at a pawn shop? The answer is easy. NO! No matter the circumstances, selling a house quickly and “UGLY” is never a good idea. In today’s market of extremely high priced houses, why would anyone sell without first consulting with a professional about getting TOP Dollar for their home. My point is this, it’s OK to sell quickly in a must need fast cash scenario, however, sell wisely and speak with a real estate professional first. I see so many investors taking advantage of homeowners by giving them pennies on the dollar because they need a quick sale for immediate cash. If this is you, let’s talk first. I propose we sell your home for TOP Dollar by me HELPING-YOU-FLIP your home for maximum profit to the seller, not the investor! Makes sense right? Dont sell your “UGLY” house for pennies on the dollar. Let me help you fix or repair your home so it can become a FLIP house and sell for TOP DOLLAR!

The end game here is simple. Don’t sell you home UGLY and miss out on the record high housing market. Let’s talk first. Let me HELP-YOU-FLIP your home for maximum profit.

  • Need to sell, but you need cash immediately, no problem.
  • Need to sell, but you don’t have the cash to remodel your kitchen and baths first, no problem.
  • Need to sell, but your house needs paint and new carpet first, no problem.

Whatever the scenario, contact me first. Don’t sell to the Caveman for quick cash. Let me HELP-YOU-FLIP your home for maximum profit to the YOU THE SELLER!

Tell a friend! I love referrals!

Roy Hernandez
TNG Real Estate Consultants
Royaltyagent@gmail.com
cell/text 949.922.3947

[gravityform id=”22″ title=”true” description=”true”]

Filed Under: Roy's Blog

1% Down Payment Loan-No PMI

September 14, 2018 By Roy Hernandez Leave a Comment

Hello!

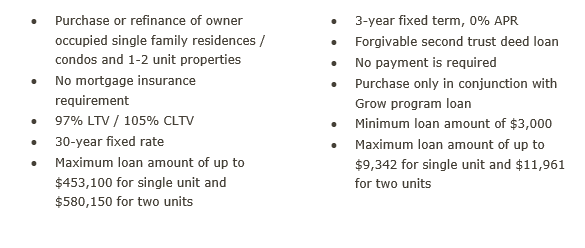
With homes prices going up and no price relief on the horizon, lenders are coming up with new ways to get buyers into houses. My lender David Wood of 20 years has a new loan program for income qualified buyers short of a large down payment. See below for details.

1. Buyer puts 1% down.

2. We do a 97% loan with no PMI.

3. We do a 2nd loan for 2% of the price which has no payments and is forgiven at the end of three years.

4. Good in Orange and LA Counties only. More details below.

Contact me if you or someone you know is interested in the loan.

I Love Referrals!!
Previous Google Posts
Search for Homes | Buyer’s Guide  |  Seller’s Guide  |  I’ll SELL Your Home   |  How much is my Home Worth  | Blog Posts |
Roy Hernandez & Associates
Your Trusted Partner in Real Estate
TNG Real Estate Consultant
Roy@RoyalAgent.net
949.922.3947

Filed Under: Roy's Blog

Selling Your Home? Heed These Hacks for Hiding All Your Junk

October 24, 2017 By Roy Hernandez Leave a Comment

In a perfect world, you’d be able to move out of your old home and into your new one before putting your old house on the market.

But (sadly) this is the real world. So there’s a strong likelihood that you may need to keep living in your home while you’re selling it—along with all the stuff you need to actually live.

It’s a delicate balance that nearly every seller faces. But there’s no need to worry: If you can’t store your belongings off-site and professionally stage your home, you can still make it look like you did. The key is hiding your junk, and hiding it well.

Know where buyers will look

Your first inclination might be to shove all your stuff into your home’s natural storage spaces—in closets, under cabinets, or in utility areas such as the laundry room or garage. But here’s the problem with that plan: Eager buyers, yearning for storage space, are going to peek in those very spaces.

“Storage space sells homes, and you want home buyers to think you have plenty of it,” says Noelle Nielsen, a real estate professional with Re/Max Advantage Plus in Eagan, MN.

Do you really want rolls of wrapping paper and boxes of old yearbooks spilling out onto potential buyers every time they open the front hall closet? No—and they don’t either. It will be a major turnoff because buyers want to know they’ll have enough room to store their stuff. In fact, stagers recommend that you clear out half of each closet to give buyers the impression of space.

Cut down on your junk

You want buyers to notice your house, not your random stuff. And the key to that is having less stuff to begin with.

When I was buying my first home, I toured houses full of creepy doll collections; built-in bookshelves jam-packed with old magazines and older newspapers; and entire bedrooms almost entirely stuffed with boxes. What I remember about those homes is the clutter. What I can’t even recall are details about the number of bedrooms or size of the kitchen.

So don’t just spend a couple of hours before the first showing tossing unwanted stuff in a donation pile. As soon as you decide you’re going to sell, take a thorough look at your stuff and try to see it the way a buyer would.

“Living somewhere daily reduces the things you notice that might be a problem,” says Marty Basher, a home organization expert for Modular Closets. “You need to take a critical eye to your home and get rid of all the junk that irritates you. If it irritates you, it will certainly turn off a buyer.”

And don’t just address the spots you can see when you first walk in.

For example, “if there’s clutter above your fridge, organize it—or better yet, find a place to hide it,” Nielsen says. Or throw it out! Do you really still need that 10-year-old Emeril Lagasse cookbook?

Act like you’re going to college

If you’re still living in the home, there will be some rooms you simply need to use every day. But there is a trick you can use to keep them seemingly pristine.

“I tell my clients to act like they’re going to college,” Nielsen says. Starting with the bedroom, she recommends packing any clothes and shoes you’re not using now in suitcases and then store those suitcases neatly under the bed or in the closet.

Once you’ve done that, go a step further and get obsessive about your closets. “Organize by color,” Nielsen says. “It looks good and makes people feel like they’re walking through a store.”

Store like a pro

So, you’ve decluttered and donated and decluttered again. But you still have all this stuff. Where do you hide it where it won’t be discovered by would-be buyers?

If you don’t have the means to rent a storage space, then think low and think high. Buyers aren’t likely to peek under your bed, behind the dresser, or in your attic. Make these your primary storage areas for knickknacks, seasonal items, and other bulk.

In the kitchen, move your miscellaneous items and bulkier tools to the very back of the top shelf in your overhead cabinets, getting it out of the line of sight. For the lower cabinets, make sure dishes are stacked neatly and there’s plenty of space around each item. Store your coffee, food, and spices in wicker baskets, and place the baskets in the pantry.

In the bathroom, pack up anything you don’t use regularly—like that extra set of curlers or the electric razor you haven’t touched since you started shaving. For everything else, invest in a couple of shower caddies.

“When you have a showing, you can easily store the caddy under the sink,” Nielsen says.

Keep the same neat and tidy appearance in the other rooms of your house. If you want bonus points, get rid of any countertop storage containers or over-the-door hangers for items such as jewelry, shoes, or toiletries. As a buyer, seeing storage containers out in the open signals, “Hey, there isn’t enough storage here so we had to get creative.”

Just remember human nature: If buyers can peek inside a room, cabinet, or drawer, they probably will.

By Angela Colley | Oct 19, 2017 | Realtor.com

[gravityform id=”22″ title=”true” description=”true”]

Filed Under: Roy's Blog

OC Housing Report: Home Supply Slicing Into Sales

September 21, 2017 By Roy Hernandez 1 Comment

Article & pictures courtesy of Steven Thomas at QEDS.

Hello!

The lack of homes for sale in Orange County has hit pending
sales activity.

Supply Cuts Pending Sales: The number of pending sales over the past month dropped by 7% due to a supply of homes that is now dropping as well.

Homeowners have been behaving differently ever since the Great Recession began a decade ago. A trend evolved and it has not changed since 2008. That trend is a drought of homeowners opting to sell their homes. In fact, this year it has been even more pronounced.

The number of homes placed on the market this year is the second lowest level this century behind 2012. The lack of homes FOR SALE back then was understandable as home values were only starting to rise and many homeowners were upside down in their homes, owing more than their homes were worth. Flash forward five years later to today and home values have appreciated substantially (the median value of a resale home has increased by more than 60%). Even with the extra equity, homeowners are opting to stay put and are not moving. The trend continues.

This year, there have been 7% fewer homes that have come on the market compared to last year, 2,055 fewer to be exact. For perspective, there have been 18,000 fewer FOR SALE signs this year compared to 2004. This lack of inventory has hurt the true potential for closed sales. With interest rates below 4%, buyers have been chomping at the bit to purchase; yet, they face stiff competition due to a lack of supply.

Today there are 20% fewer choices on the market compared to last year, 5,639 versus 7,040. As a result, the number of pending sales over the prior month (how Reports On Housing gauges demand), dropped in the past couple of weeks by 7%, with 201 fewer pending sales, now totaling 2,624. Today’s demand is 3% off of last year’s 2,719. The lack of supply is truly cutting into the number of pending sales and has undercut demand.

Article & pictures courtesy of Steven Thomas at QEDS.

True demand, buyers ready, willing and able to buy today, is much higher than the pending sales count is showing simply because of not enough choices. There are insufficient homes FOR SALE in the lower ranges, homes priced below $750,000. This range accounts for 39% of the inventory and 60% of demand. If there were more homes available within this range, the number of pending sales, and ultimately closed sales, would skyrocket. This price range is underserved as fewer and fewer homeowners are electing to sell. There are 41% fewer active listings available today below $500,000 compared to last year, and the expected market time (the amount of time it will take a home placed on the market today to open escrow) is a blistering hot 36 days. There are 22% fewer homes available between $500,000 and $750,000, and the expected market time is a hot 46 days. These hot markets are a direct result of a skimpy supply all year long.

There are 25% fewer homes on the market between $750,000 to $1 million, yet the expected market time is at 56 days, not as hot as the lower price ranges. Even though there are fewer choices for buyers, sellers better be priced on the money or they won’t be successful. For homes priced above $1 million, there may be slightly fewer homes on the market compared to last year; however, the expected market time runs from 93 days ($1 million to $1.25 million) to 460 days ($4 million and up). These sellers not only need to be priced precisely on target, they must pack their patience as well.

Article & pictures courtesy of Steven Thomas at QEDS.

The bottom line: the Orange County housing market could use more homes on the market, especially in the lower ranges. This lack of inventory has diminished the number of pending and closed sales and has prevented local housing from reaching its full potential.

Active Inventory: The active inventory dropped by 4% over the past couple of weeks. The active listing inventory shed 223 homes in the past two weeks and now sits at 5,639. It is the lowest level for this time of the year since 2012. The active inventory is falling as expected now that the Autumn Market is here. It will continue to trend down through the remainder of the year, picking up steam after Thanksgiving, the start of the Holiday/Winter Market.

Last year at this time, there were 7,040 homes on the market, 1,401 additional homes or 25% more than today.

Article & pictures courtesy of Steven Thomas at QEDS.

Demand: Demand decreased by 7% in the past couple of weeks.
Demand, the number of homes placed into escrow within the prior month, decreased by 201 pending sales, or 7%, in the past two-weeks and now totals 2,624. The drop is primarily due to a lack of available choices in the lower ranges below $750,000. For homes priced above $750,000, with the only exception being homes between $1.5 million to $2 million, demand is actually up year over year. There have also been slightly more homes placed on the market year over year for these higher price ranges.

Last year at this time, demand was at 2,719 pending sales, 95 more than today.

Luxury End: Luxury demand plunged by 7% in the past couple of weeks and the inventory dropped by 1%.
In the past two weeks, demand for homes above $1.25 million decreased from 385 to 358 pending sales, a 7% drop. The luxury home inventory decreased from 2,002 homes to 1,979, a 1% drop. As a result, the expected market time for all homes priced above $1.25 million increased from 156 days to 166 days. The luxury inventory and demand will continue to drop through the end of the year.

For homes priced between $1.25 million and $1.5 million, the expected market time decreased from 98 to 90 days. For homes priced between $1.5 million and $2 million, the expected market time increased from 134 to 171 days. For homes

Article & pictures courtesy of Steven Thomas at QEDS.

priced between $2 million and $4 million, the expected market time increased from 185 days to 198 days. In addition, for homes priced above $4 million, the expected market time decreased from 462 to 460 days. At 460 days, a seller would be looking at placing their home into escrow around the mid-December 2018.

Orange County Housing Market Summary:

• The active listing inventory decreased by 223 homes in the past couple of weeks, and now totals 5,639. The trend is down for the remainder of the year. Last year, there were 7,040 homes on the market, 1,401 more than today.

• There are 41% fewer homes on the market below $500,000 today compared to last year at this time and demand is down by 21%. Fewer and fewer homes and condominiums are now priced below $500,000. This price range is slowly disappearing.

• Demand, the number of pending sales over the prior month, decreased by 201 homes in the past couple of weeks, down 7%, and now totals 2,624. The average pending price is $860,101.

• The average list price for all of Orange County increased from $1.6 million to $1.7 million. This number is high due to the mix of homes in the luxury ranges that sit on the market and do not move as quickly as the lower end.

• For homes priced below $750,000, the market is HOT with an expected market time of just 42 days. This range represents 39% of the active inventory and 60% of demand.

• For homes priced between $750,000 and $1 million, the expected market time is 56 days, a hot seller’s market (less than 60 days). This range represents 18% of the active inventory and 20% of demand.

• For homes priced between $1 million to $1.25 million, the expected market time is 93 days, a balanced market that does not favor a buyer or seller.

• For luxury homes priced between $1.25 million and $1.5 million, the expected market time decreased from 98 days to 93. For homes priced between $1.5 million and $2 million, the expected market time increased substantially from 134 to 171 days. For luxury homes priced between $2 million and $4 million, the expected market time increased from 185 days to 198 days. For luxury homes priced above $4 million, the expected market time decreased from 462 to 460 days.

• The luxury end, all homes above $1.25 million, accounts for 34% of the inventory and only 14% of demand.

• The expected market time for all homes in Orange County increased in the past couple of weeks from 61 days to 62 days, a tepid seller’s market (60 to 90 days). From here, we can expect the market time to slowly rise as housing makes its way through the Autumn Market.

• Distressed homes, both short sales and foreclosures combined, make up only 1.5% of all listings and 2.4% of demand. There are only 33 foreclosures and 54 short sales available to purchase today in all of Orange County, that’s 87 total distressed homes on the active market, increasing by 5 in the past two weeks. Last year there were 125 total distressed sales, 44% more than today.

• There were 3,110 closed sales in August, a 12% increase over July 2017 and a 1.3% increase over August 2016. The sales to list price ratio was 98.1% for all of Orange County. Foreclosures accounted for just 0.8% of all closed sales and short sales accounted for 0.7%. That means that 98.5% of all sales were good ol’ fashioned equity sellers.

Have a great week.

Sincerely,
Roy A. Hernandez
TNG Real Estate Consultants
Cell 949.922.3947

[gravityform id=”22″ title=”true” description=”true”]

Filed Under: Roy's Blog

OC Housing Report: A Blazing Hot Autumn

September 1, 2017 By Roy Hernandez Leave a Comment

Article and pictures courtesy of Steven Thomas, QEDS

Good Afternoon!

With an extremely low inventory and blistering demand, the
Autumn Market is poised to be the hottest in years.

A Hot Autumn: With 19% fewer FOR SALE signs this year compared to last, the Autumn Market is going to be hot.

It is that time of the year. Have you seen all of the signs? The leaves are starting to fall, the kids are back in school, and Costco already has Halloween costumes. That is right, autumn is here. The official start to autumn is not until Friday, September 22, but all of the signs are here.

As for Orange County housing, the Autumn Market typically starts around the end of August when the kids head back to their classrooms. It’s no longer the “prime” season for real estate. Both the Spring and Summer Markets are in the past. Housing will now shift gears and transition to a slower time of the year. This year will not be an exception, demand will fall, sales will fall, and the expected market time will start to rise. Nevertheless, this year will be the hottest Autumn Market since 2005.

Today, there are 19% fewer FOR SALE signs on the active listing inventory right now compared to last year at this time. In fact, the last time the supply of homes was this low at the end of August dates back to 2012 when the active inventory was dropping like a rock. And, in spite of this year being the second fewest number of homeowners opting to place their homes on the market this century (2012 was the lowest), demand has remained strong. Demand, the number of new pending sales over the prior month, is still at end of March levels. As a result, the current expected market time is at levels not seen since 2013.

Article and pictures courtesy of Steven Thomas, QEDS

The expected market time takes into account both supply and demand. It is the amount of time a seller can expect to be on the market before opening up escrow. It is the velocity of the market as a whole. Todays expected market time is 62 days, 19% lower than last year’s 77 days. At 62 days, all of Orange County it is a seller’s market. It is no longer a HOT seller’s market, below 60 days, as it was from the end of January to the middle of June of this year, but it is still hotter than July’s 63 day expected market time.

Everything priced below the $1 million mark, is flying off the shelves. The expected market time for homes priced below $500,000 is 34 days. Now that is hot! Above $1 million is a bit of different story, the higher the price, the slower the market. For homes priced above $4 million, the expected market time rises to 462 days.

From here, we can expect the active listing inventory to continue to fall throughout the remainder of 2017. Demand, in terms of new pending sales, will slowly but surely drop throughout the Autumn Market. It will then drop like a rock from Thanksgiving through the end of the year. With both the inventory and demand dropping, the expected market time will only rise slightly for the remainder of the year.

A warning for sellers: do not stretch the asking price much at all. Word from the real estate trenches indicates that many homeowners in the lower ranges are sitting on the market with very little activity and no offers to purchase because of price. In spite of the hotter real estate market, buyers are not willing to overpay for a property. As a seller, if you have been on the market for a while and the number of buyer showings has dropped considerably, the market is speaking to you. It is most likely the price. Homes that are priced well, taking into consideration condition, upgrades, and location, will attract offers to purchase.

A warning for buyers: do not expect the market dynamics to change much in the coming months. Even with a drop in buyer demand during the autumn and Holiday Markets, meaning less buyer competition, there will also be a drop in the number of homeowners placing their homes on the market. Many homeowners will opt to pull their homes off of the market now that both the Spring and Summer Markets are in the rearview mirror. Ultimately, there will be fewer choices. With a drop in both supply and demand at the same time, the expected market time will not fluctuate much.

 Active Inventory: The active inventory dropped only slightly during the past couple of weeks.
The active listing inventory shed 15 homes in the past two weeks and now sits at 5,862. Fifteen homes may not be a lot, but it illustrates the direction that the active listing inventory will be heading for the remainder of the year: DOWN. It is the second lowest level this century, trailing only 2012. Typically, the inventory peaks around mid-August, but this year it peaked in mid-July.

Last year at this time, there were 7,267 homes on the market, 1,405 additional homes or 24% more than today.

Article and pictures courtesy of Steven Thomas, QEDS

Demand: Demand decreased by 2% in the past couple of weeks.
Demand, the number of homes placed into escrow within the prior month, decreased by 65 pending sales, or 2%, in the past two-weeks and now totals 2,825. Demand is off the most in the lower end, homes priced below $750,000. Today, there are 39% fewer homes available below $500,000 compared last year at this time and demand is off by 20%. Obviously, there is plenty of pent up demand and this data point would be through the roof if there were more homes available. Demand is off by 7% for homes priced between $500,000 and $750,000 with 20% fewer homes on the market. Above $750,000, demand is stronger this year compared to last year despite fewer homes on the market.

Last year at this time, demand was at 2,843 pending sales, 18 more than today.

Luxury End: Luxury demand increased by 4% in the past couple of weeks and the inventory dropped by 3%.
In the past two weeks, demand for homes above $1.25 million increased from 369 to 385 pending sales, a 4% increase. The luxury home inventory decreased from 2,072 homes to 2,002, a 3% drop. As a result, the expected market time for all homes priced above $1.25 million dropped from 168 days to 156 days. The luxury inventory will continue to drop through the end of the year. Similarly, luxury demand will drop significantly through the end of the year, but it will bounce around a bit, typically increasing slightly in October.

For homes priced between $1.25 million and $1.5 million, the expected market time decreased from 110 to 98 days. For homes priced between $1.5 million and $2 million, the expected market time increased from 130 to 134 days. For homes priced between $2 million and $4 million, the expected market time decreased from 224 days to 185 days. In addition, for homes priced above $4 million, the expected market time decreased from 480 to 462 days. At 468 days, a seller would be looking at placing their home into escrow around the start of December 2018.

looking at placing their home into escrow around the start of December 2018.

Article and pictures courtesy of Steven Thomas, QEDS

Orange County Housing Market Summary:

• The active listing inventory decreased by 15 homes in the past couple of weeks, and now totals 5,862. The trend is down for the remainder of the year. Last year, there were 7,267 homes on the market, 1,405 more than today.

• There are 39% fewer homes on the market below $500,000 today compared to last year at this time and demand is down by 20%. Fewer and fewer homes and condominiums are now priced below $500,000. This price range is slowly disappearing.

• Demand, the number of pending sales over the prior month, decreased by 65 homes in the past couple of weeks, down 2%, and now totals 2,825. The average pending price is $866,086.

• The average list price for all of Orange County remained at $1.6 million. This number is high due to the mix of homes in the luxury ranges that sit on the market and do not move as quickly as the lower end.

• For homes priced below $750,000, the market is HOT with an expected market time of just 40 days. This range represents 40% of the active inventory and 60% of demand.

• For homes priced between $750,000 and $1 million, the expected market time is 57 days, a hot seller’s market (less than 60 days). This range represents 18% of the active inventory and 19% of demand.

• For homes priced between $1 million to $1.25 million, the expected market time is 78 days, a tepid seller’s market with very little appreciation.

• For luxury homes priced between $1.25 million and $1.5 million, the expected market time decreased from 110 days to 98. For homes priced between $1.5 million and $2 million, the expected market time increased from 130 to 134 days. For luxury homes priced between $2 million and $4 million, the expected market time dropped from 224 days to 185 days. For luxury homes priced above $4 million, the expected market time decreased from 480 to 462 days.

• The luxury end, all homes above $1.25 million, accounts for 34% of the inventory and only 14% of demand.

• The expected market time for all homes in Orange County increased in the past couple of weeks from 61 days to 62 days, a tepid seller’s market (60 to 90 days). From here, we can expect the market time to slowly rise as housing makes its way through the Autumn Market.

• Distressed homes, both short sales and foreclosures combined, make up only 1.4% of all listings and 2.7% of demand. There are only 30 foreclosures and 52 short sales available to purchase today in all of Orange County, that’s 82 total distressed homes on the active market, dropping by 6 in the past two weeks. Last year there were 136 total distressed sales, 66% more than today.

• There were 2,768 closed sales in July, a 14% drop over June 2017 and a 1.9% decrease over July 2016. The sales to list price ratio was 98.2% for all of Orange County. Foreclosures accounted for just 0.8% of all closed sales and short sales accounted for 0.8%. That means that 98.4% of all sales were good ol’ fashioned equity sellers.

Have a great week.

Sincerely,
Roy Hernandez
TNG Real Estate Consultants
Cell 949.922.3947
[gravityform id=”22″ title=”true” description=”true”]

Filed Under: Roy's Blog

Home sellers see biggest profits in a decade

August 3, 2017 By Roy Hernandez Leave a Comment

Home sellers see biggest profits in a decade — not just because of higher prices

  • The average tenure of a homeowner who sold in the second quarter of this year came in at just over eight years.
  • That’s the longest since the year 2000 when Attom Data Solutions began tracking the metric.
  • During the last housing boom, in the mid-2000s, the average homeownership tenure was around four years.

In this hot housing market, home sellers are racking up bigger profits on their homes than they have in a decade. Fast-rising home prices, coupled with homeowners staying put longer than usual are driving the trend.

The average tenure of a homeowner who sold in the second quarter of this year came in at just over eight years, the longest since the year 2000, when ATTOM Data Solutions began tracking the metric. During the last housing boom, in the mid-2000s, the average homeownership tenure was around four years.

Home values recently hit a record high, according to various surveys, and they continue to climb, as demand easily outpaces the supply of homes for sale. Add price gains to increased tenure, and home sellers are now seeing the greatest returns in 10 years. For those who sold in the second quarter of this year, they saw an average profit of $51,000, a 26 percent return.

Regionally, sellers saw the biggest profits in San Jose, California, with 75 percent; San Francisco with 65 percent; Seattle with 63 percent; Modesto, California, with 62 percent; and Denver with 62 percent.

It begs the question, if profits are high and homeowners have been stagnant, why don’t more people decide to move?


“While it’s the most profitable time to sell in a decade, it’s also extremely difficult to find another home to purchase, which is helping to keep homeowners in their homes longer before selling,” said Daren Blomquist, senior vice president at Attom Data Solutions. “And the market is becoming even more competitive, with the share of cash buyers in the second quarter increasing annually for the first time in four years.”

Cash sales accounted for close to 29 percent of all single-family and condo sales in the second quarter, up from 27 percent during the same period in 2016.

As with everything in real estate, local market dynamics affect that share. Among major metropolitan areas with a population of at least 1 million, those with the highest share of all-cash sales were Raleigh, North Carolina, at 57.4 percent; Miami with 46.2 percent; Detroit at 45.2 percent; Oklahoma City at 44.6 percent; and Tampa-St. Petersburg, Florida, at 43.2 percent.

Those markets see an outsized share of both investors and foreign buyers, and both of those cohorts tend to favor cash.


Diana Olick | @DianaOlick-CNBC
Thursday, 27 Jul 2017 | 10:55 AM ET

[gravityform id=”22″ title=”true” description=”true”]


Filed Under: Roy's Blog

OC Housing Report: Mid Year Checkup

July 21, 2017 By Roy Hernandez Leave a Comment

Article and pictures courtesy of Steven Thomas, QEDS

Hello!

With half of 2017 in the rearview mirror, it is helpful to take a
look at where housing has been, where it is now, and where
it is heading.

Housing Checkup: Every once in a while, it is helpful to take a step back and evaluate the overall health of the current housing market and the latest trends.
The Orange County housing market has been hot for a very long time. It is working on its sixth year of continuous appreciation. Home values have surpassed record heights reached in June of 2007. There have not been enough homes on the market, buyers continue to trip over each other in pursuit of their piece of the American Dream, and multiple offers are the norm. That adequately describes the first half of 2017, so where do we go from here? Will it be more of the same or will the market evolve?

Let’s take a step back from the relentless real estate market for a moment. With a stethoscope, thermometer, and blood pressure cuff in hand, here are the latest trends and current heartbeat of the Orange County housing market:

• 2017 has been the year of the extremely lean active inventory. The year started with only 4,071 homes on the market, the lowest level since 2013. Since then, the active inventory has grown, but at a much slower pace than normal. It has been slim pickings. There have been 6% fewer homes placed on the market so far this year compared to 2016. In the past month alone, 11% fewer homes have entered the fray, resulting in an active inventory that only grew by 78 homes. It seems as if the housing market has already peaked, yet the inventory has not quite reached the 6,000 home mark. The inventory needs to be at 8,000 homes for it to move away from a seller’s market to one that is balanced, not favoring a buyer or seller; but that is not going to happen anytime soon. Today’s inventory is 18% lower than last year. It will remain at about 6,000 homes through the rest of the Summer Market and then will start to fall during the Autumn Market as unsuccessful homeowners throw in the towel, realizing that both the Spring and Summer Markets will be in the past.
• Demand has been hot this year, but has been muted a bit due to a lack of inventory. With fewer homes coming on the market this year, demand has not reached its full potential. In spite of that, it has reached levels similar to last year, surpassing 2016 for the first couple of months. From there, it has fallen slightly short of last year’s levels. The latest reading has demand surpassing 2016 slightly. From here, demand will slowly drop as summer progresses. It will continue its descent throughout the Autumn Market and will reach the lowest levels of the year during the Holiday Market, Thanksgiving through January 2018. With demand slowing a bit due to all of the summer distractions, carefully pricing is fundamental in order for sellers to find success. That will hold true for the remainder of the year.
• The expected market time is on the rise, but the overall market is a lot hotter than last few years. Supply (the inventory) and demand (recent pending sales) determines the expected market time. That is the amount of time it will take for a newly listed home to be placed into escrow. When it drops below 2 months, it is a HOT seller’s market. From February through the mid-June, the market was HOT, two months longer than last year. Since then, the market has exceeded 60 days, indicating a tepid seller’s market. In a tepid seller’s market, carefully pricing is essential and appreciation slows. Sellers were getting away with stretching the asking price and home values were appreciating swiftly. With the Summer Market rolling along, the pace has slowed a bit. For all of Orange County, it has risen from 51 days in the heart of the Spring Market to 63 days today. All price ranges are slowing, but it is still HOT below $750,000. It is important to note that the higher the price, the longer it takes to find success. The market will continue to slow throughout the summer. As the market downshifts, buyers move away from a willingness to pay any price to obtain a home, to a strong desire to pay the Fair Market Value for a home, a value determined by the most recent pending and closed sales. It will remain a tepid seller’s market for the remainder of 2017.
• Closed sales are slightly higher than last year and it looks as if that will not change for the remainder of the year. Through the first half of the year, there have been 15,658 closed sales compared to 15,219 last year, 3% more. With slightly higher demand for the remainder of the year, closed sales will remain a bit higher than last year.
• Luxury home sales have surpassed last year’s record pace, but there is still a lot of seller competition to overcome in order to find success. The luxury market is best defined as the top 10% of closed sales, or $1,250,000 and higher. For the first six months, there have been 1,864 closed luxury sales compared to 1,532 last year, 22% more. That is a record number of luxury sales in Orange County. However, as of today there are 2,089 active listings above $1,250,000, more than have sold in the first half of this year. Today, the expected market time for luxury homes is 190 days. For proper perspective, that would mean that escrow would open up at the end of January of next year. Keep in mind, the expected market time is even longer in the higher price ranges. For homes priced above $2 million, the expected market time is 269 days, opening escrow in April 2018.
• In spite of the Federal Reserve raising the short-term rate, interest rates have slowly inched their way back below 4%. The Federal Reserve has been talking a big game for a few years now about raising the short-term rate. After years of bluffing, they have backed up all of the talk and have raised rates three times, including the one last December. Yet, rates have not been behaving at all like expected by economic experts or prognosticators. After the presidential elections in November, interest rates climbed significantly at the prospect of inflation and reached 4.375% by the end of 2016. However, with the realization that the new presidential administration’s inflationary policies may take years to implement, long-term interest rates have floated back down to below 4%, reaching 3.91% in June. As international economic uncertainty continues, everybody is seemingly “parking their money” in US Treasuries as a “safe haven,” ultimately insuring that the low interest rate environment continues. Interest rates will not change much for the remainder of the year and they will continue to stoke the flames of demand.

Active Inventory: The active inventory increased by only 47 homes in the past couple of weeks.
The active listing inventory added an additional 47 homes in the past two-weeks, a 1% increase, and now sits at 5,983, poised to surpass the 6,000 home mark. The inventory is only slowly growing and it looks as if this year’s peak will be right around that 6,000 home mark. Quite simply, not enough homes are coming on the market as more and more homeowners are opting to stay put.

Last year at this time, there were 7,329 homes on the market, 1,346 additional homes or 22% more than today.

Article and pictures courtesy of Steven Thomas, QEDS


Demand: Demand decreased by 2% in the past couple of weeks.
Demand, the number of homes placed into escrow within the prior month, decreased by 55 pending sales in the past two-weeks and now totals 2,830, a 2% decline. Demand is off the most in the entry-level market, homes priced below $500,000. With 38% fewer homes available below $500,000 compared to this time last year, it is no wonder that demand is off by 18% year over year.

Last year at this time, there were 47 fewer pending sales, totaling 2,783. The current expected market time increased from 62 to 63 days in the past couple of weeks, a much hotter market than last year’s 79 days. At 63 days, the market is no longer a HOT seller’s market, but a tepid seller’s market with muted appreciation.

Article and pictures courtesy of Steven Thomas, QEDS


Luxury End: Luxury demand decreased by 4% in the past couple of weeks while the inventory grew by 1%.
In the past two weeks, demand for homes above $1.25 million decreased from 344 to 329 pending sales, a 4% decline. The luxury home inventory increased from 2,068 homes to 2,089, up 1%. The luxury market downshift is due to summer distractions. The supply is up and demand is down.

For homes priced between $1.25 million and $1.5 million, the expected market time increased from 120 to 123 days. For homes priced between $1.5 million to $2 million, the expected market time increased from 155 to 176 days. In addition, for homes priced above $2 million, the expected market time increased from 266 days to 269 days. At 269 days, a seller would be looking at placing their home into escrow around the beginning of April of next year.

Article and pictures courtesy of Steven Thomas, QEDS


Orange County Housing Market Summary:

• The active listing inventory increased by just 47 homes, or 1%, in the past couple of weeks, and now totals 5,983, knocking on the door of the 6,000 home level. Last year, there were 7,329 homes on the market, 1,346 more than today.

• There are 38% fewer homes on the market below $500,000 today compared to last year at this time and demand is down by 18%. Fewer and fewer homes and condominiums are now priced below $500,000. This price range is slowly disappearing.

• Demand, the number of pending sales over the prior month, decreased by 2% in the past couple of weeks, dropping by 55 pending sales and now totals 2,830. The average pending price is $829,260.

• The average list price for all of Orange County remained at $1.6 million. This number is high due to the mix of homes in the luxury ranges that sit on the market and do not move as quickly as the lower end.

• For homes priced below $750,000, the market is HOT with an expected market time of just 39 days. This range represents 39% of the active inventory and 63% of demand.

• For homes priced between $750,000 and $1 million, the expected market time is 57 days, a hot seller’s market (less than 60 days). This range represents 18% of the active inventory and 20% of demand.

• For homes priced between $1 million to $1.25 million, the expected market time is at 93 days, a balanced market that does not favor a buyer or seller.

• For luxury homes priced between $1.25 million and $1.5 million, the expected market time decreased from 120 to 123 days. For homes priced between $1.5 million to $2 million, the expected market time increased from 155 to 176 days. For luxury homes priced above $2 million, the expected market time increased from 266 to 269 days.

• The luxury end, all homes above $1.25 million, accounts for 34% of the inventory and only 11% of demand.

• The expected market time for all homes in Orange County increased from 62 days to 63 in the past couple of weeks, a tepid seller’s market (60 to 90 days). From here, we can expect the market time to slowly rise throughout the Summer Market.

• Distressed homes, both short sales and foreclosures combined, make up only 1.5% of all listings and 1.8% of demand. There are only 36 foreclosures and 51 short sales available to purchase today in all of Orange County, that’s 87 total distressed homes on the active market, 11 more than two weeks ago. Last year there were 128 total distressed sales, 47% more than today.

• There were 3,229 closed sales in June, a 3% increase over May 2017 and a 3% increase over June 2016. The sales to list price ratio was 97.9% for all of Orange County. Foreclosures accounted for just 0.99% of all closed sales and short sales accounted for 0.87%. That means that 98% of all sales were good ol’ fashioned equity sellers.


Have a great week.

Sincerely,
Roy A. Hernandez
TNG Real Estate Consultants
Cell 949.922.3947
Royaltyagent@gmail.com

[gravityform id=”22″ title=”true” description=”true”]

Filed Under: Roy's Blog

OC Housing Report: Waiting on Change?

July 6, 2017 By Roy Hernandez Leave a Comment

Story and pictures courtesy of Steven Thomas, QEDS

Hello,

Many would be buyers are holding off on purchasing and
waiting for the market to change.

When Will the Market Change: The Orange County housing market has reached record heights and has been appreciating for over five years now.

The Orange County Housing Market has been going up nonstop for over five years now. It has been like the initial chain lift hill on one of the many roller coasters at Knott’s Berry Farm. Clickety clack, clickety clack, clicket clack… it seems as if the housing roller coaster could go up forever. Yet, many buyers believe that roller coaster ascent has to reach a peak soon.

Housing does not go up forever. There are peaks and there are troughs. There are times when buyers are in control, and there are times when sellers are in control. The skeptical buyers who are waiting for an end to this madness find many reasons for a housing downturn on the horizon. They point to record prices. They recall mid-2007 when the housing market began to unravel; however, prior to it unravelling, almost everybody felt like the market would increase forever. Very few economists and prognosticators forecasted a crippling housing downturn.

It is completely understandable where these buyers are coming from. They are right. The market will eventually reverse course and depreciate. The questions boils down to “when?” The answer is simply, “not anytime soon.”

To better understand why the market is poised to continue to accelerate forward, it is best to dust off that old Econ 101 book that details supply and demand. When there is too much supply and demand is low, it favors the buyer. When there is not enough supply and demand is high, it favors the seller. With years of a lack of supply of homes and red hot demand, it is no wonder that it has been a hot sellers market for quite some time now.

Story and pictures courtesy of Steven Thomas, QEDS

Currently, there are 5,936 homes on the market, the lowest level for this time of the year since 2013. Back then there were 4,732 homes on the market and it was even more difficult for buyers to secure a home than it is today. For housing to move away from a seller’s market towards a balanced market, one that does not favor a buyer or seller, there needs to be at least 8,000 homes on the market for a sustainable amount of time. The more homes on the market, the higher the supply of homes. With more supply often comes softer demand. Only then could housing finally shift towards a buyer’s market.

That is the issue. Supply needs to increase and demand soften. For proper perspective, at the end of June 2007, there were 17,250 homes on the market and the expected market time was over 9-months (that is the amount of time a home is on the market prior to being placed into escrow). Demand (the last month of pending sales) was at 1,894 back then compared to 2,885 today. The current expected market time is 62 days, quite a bit different than a decade ago.

The trend of a lack of inventory and red hot demand stoked by ultra low interest rates, does not look like it will change course anytime soon. Multiple offers is the norm. This holds true for just about any property priced below $1.25 million that is in great condition, nicely appointed, in a good location, and priced right, close to its Fair Market Value. And, in the lower price ranges, buyers are tripping over each other to secure their piece of the American Dream.

For buyers waiting on the market to change, they are in store for a long wait.

Active Inventory: The active inventory increased by only 31 homes in the past couple of weeks.
The active listing inventory added an additional 31 homes in the past two-weeks, a 1% increase, and now sits at 5,936. The biggest issue for Orange County housing this year has been a real lack of inventory. Thus far this year, there have been 6% fewer homes placed on the market. In the past month alone, there have been 10% fewer homes placed on the market. This issue has prevented additional closed sales and has undermined the performance of housing this year.

We can expect the inventory to continue to rise throughout the Summer Market until it reaches a peak somewhere around mid-August. From there, the market will transition into the Autumn Market, from mid-August through Thanksgiving, with fewer homes coming on the market with both the spring and summer in the rearview mirror.

Last year at this time, there were 7,104 homes on the market, 20% more than today.

Story and pictures courtesy of Steven Thomas, QEDS

Demand: Demand decreased by 2% in the past couple of weeks.
Demand, the number of homes placed into escrow within the prior month, decreased by 52 pending sales in the past two-weeks and now totals 2,885, a 2% decline. Demand is off the most in the entry-level market, homes priced below $500,000. With 22% fewer homes that have been placed on the market so far this year below $500,000, demand is now off by 17%. This market has been underperforming all year due to a real lack of inventory.

We can expect demand to drop slightly from now through the end of the summer.

Last year at this time, there were 2 more pending sales totaling 2,887, almost identical. The expected market time increased from 60 to 62 days in the past couple of weeks. At 62 days, the market is no longer a HOT seller’s market, but a tepid seller’s market with muted appreciation. Last year it was at 74 days.

Luxury End: Luxury demand decreased by 7% in the past couple of weeks while the inventory grew by 3%.
In the past two weeks, demand for homes above $1.25 million decreased from 371 to 344 pending sales, a 7% decline. The luxury home inventory increased from 2,011 homes to 2,068, up 3%. The luxury market downshifted with the beginning of the Summer Market. The supply is up and demand is down.

For homes priced between $1.25 million and $1.5 million, the expected market time increased from 96 to 120 days. For homes priced between $1.5 million to $2 million, the expected market time increased from 148 to 155 days. In addition, for homes priced above $2 million, the expected market time increased from 253 days to 266 days. At 266 days, a seller would be looking at placing their home into escrow around the end of March of next year.

Story and pictures courtesy of Steven Thomas, QEDS

Orange County Housing Market Summary:

• The active listing inventory increased by just 31 homes, or 1%, in the past couple of weeks, and now totals 5,936, knocking on the door of the 6,000 home level. Last year, there were 7,104 homes on the market, 1,168 more than today.
• There are 39% fewer homes on the market below $500,000 today compared to last year at this time and demand is down by 17%. Fewer and fewer homes and condominiums are now priced below $500,000. This price range is slowly disappearing.

• Demand, the number of pending sales over the prior month, decreased by 2% in the past couple of weeks, declining 52 pending sales and now totals 2,885. The average pending price is $830,508.

• The average list price for all of Orange County remained at $1.6 million. This number is high due to the mix of homes in the luxury ranges that sit on the market and do not move as quickly as the lower end.

• For homes priced below $750,000, the market is HOT with an expected market time of just 38 days. This range represents 39% of the active inventory and 62% of demand.

• For homes priced between $750,000 and $1 million, the expected market time is 59 days, a hot seller’s market (less than 60 days). This range represents 18% of the active inventory and 19% of demand.

• For homes priced between $1 million to $1.25 million, the expected market time is at 79 days, a tepid seller’s market.

• For luxury homes priced between $1.25 million and $1.5 million, the expected market time decreased from 96 to 120 days. For homes priced between $1.5 million to $2 million, the expected market time increased from 148 to 155 days. For luxury homes priced above $2 million, the expected market time increased from 253 to 266 days.

• The luxury end, all homes above $1.25 million, accounts for 34% of the inventory and only 12% of demand.

• The expected market time for all homes in Orange County increased from 60 days to 62 in the past couple of weeks, a tepid seller’s market (60 to 90 days). From here, we can expect the market time to slowly rise throughout the Summer Market.

• Distressed homes, both short sales and foreclosures combined, make up only 1.3% of all listings and 2.2% of demand. There are only 27 foreclosures and 49 short sales available to purchase today in all of Orange County, that’s 76 total distressed homes on the active market, 5 more than two weeks ago. Last year there were 135 total distressed sales, 82% more than today.

• There were 3,147 closed sales in May, an 18% increase over April 2017 and a 4% increase over May 2016. The sales to list price ratio was 97.8% for all of Orange County. Foreclosures accounted for just 1.1% of all closed sales and short sales accounted for 1.7%. That means that nearly 97.2% of all sales were good ol’ fashioned equity sellers.

Have a good weekend!

Sincerely,
Roy A. Hernandez
TNG Real Estate Consultants
Cell 949.922.3947

[gravityform id=”22″ title=”true” description=”true”]

Filed Under: Roy's Blog

OC Housing Report: Slim Pickens

June 30, 2017 By Roy Hernandez Leave a Comment

Story and graphics compliments of Steven Thomas, QEDS

Hello!

For years now the Orange County housing inventory has been
low, but this year it is more pronounced.

Low Supply: The active listing inventory has been down all year and it is currently off by 14% compared to 2016. 

Whew! It is tough to be a buyer looking for a home in today’s market. The biggest complaint has to be that there are simply not enough choices. In fact, nearly 1,200 fewer homes have come on the market so far this year compared to last year. The active inventory currently sits at 5,905 homes; that is 14% fewer than the 6,868 that were available last year.

The trend of fewer homes hitting the market dates back to the beginning of the Great Recession, 2008. Ever since then, fewer and fewer homeowners have placed a FOR SALE sign in their yard. This trend is nothing close to a blip on the radar screen. Something happened to everybody’s collective psyche during the drawn out and bruising recession. Homeowners are staying put.

This year has been off from last year, averaging 222 fewer homes placed on the market each month. As the half way point for the 2017 housing market rapidly approaches, the slower pace has added up. Buyers who have been working hard to secure a home without any luck can attest to the need for additional choices. Yet, the 222 year over year difference is nothing compared to the number of homes on the market during the first decade of the 2000’s. In 2006, there were 2,239 additional homes FOR SALE coming on each and every month. That added up to an additional FOR SALE sign in just about every neighborhood on a monthly basis.

Story and graphics compliments of Steven Thomas, QEDS


Price is determined by supply and demand. Just for kicks, imagine that demand remained the same. When the same number of buyers are interested in purchasing a home, yet the supply drops considerably, the highest bidder wins. As a result, prices rise. Essentially, that is what has happened over the past five years. In 2012, demand spiked; however, there were not enough homes on the market to satiate the voracious appetite for buyers to buy. Home values have been on the rise ever since.

In past housing run-ups, homeowners have been encouraged and enticed to join the fray, eager to cash in on the market and make a move. That has not been the case during the current five year run. Homeowners have not been tempted to sell like they did from 2000 through 2007.

ADVICE FOR BUYERS: be realistic out of the gate. Don’t delay in pulling the trigger to write an offer to purchase a home. You do not have to overpay, especially now that the housing has transitioned into the Summer Market. Offer the FAIR MARKET VALUE for a home. Most of all, pack your patience.

ADVICE FOR SELLERS: be realistic out of the gate. Far too many seller hit the market overpriced. The market has been on the rise, but it does a majority of its annual appreciation during the Spring Market. Homes appreciate at a much slower rate for the rest of the year. Orange County detached housing values have been increasing at a pace of about 5% per YEAR. That is 365 days, not 30 days. So, price accordingly. A wise strategy is to price a home at its FAIR MARKET VALUE. The better the price, the more activity that is generated. Multiple offers drive the sales price up.

Active Inventory: The active inventory increased by 3% in the past couple of weeks.
The active listing inventory added an additional 148 homes in the past two-weeks, a 3% increase, and now sits at 5,905. Within the next couple of weeks, the inventory will eclipse the 6,000 home mark. Last year that occurred at the start of May.

We can expect the inventory to continue to rise throughout the Summer Market until it reaches a peak somewhere around mid-August. From there, the market will transition into the Autumn Market, from mid-August through Thanksgiving, with fewer homes coming on the market with both the spring and summer in the rearview mirror.

Last year at this time, there were 6,868 homes on the market, 16% more than today.

Story and graphics compliments of Steven Thomas, QEDS


Demand: Demand increased by 1% in the past couple of weeks.
Demand, the number of homes placed into escrow within the prior month, increased by 33 pending sales in the past two-weeks and now totals 2,937, a 1% increase. Demand is off the most in the entry-level market, homes priced below $500,000. With 23% fewer homes that have been placed on the market so far this year below $500,000, demand is now off by 21%. This market has been underperforming all year due to a real lack of inventory.

We can expect demand to drop slightly from now through the end of the Summer Market.

Last year at this time, there were 52 more pending sales totaling 3,989, or 2% more. The expected market time increased from 59 to 60 days in the past couple of weeks. At 60 days, the market is no longer a HOT seller’s market, but a tepid seller’s market with muted appreciation. Last year it was at 69 days.

Luxury End: Luxury demand increased by 6% in the past couple of weeks while the inventory grew by 2%.
In the past two weeks, demand for homes above $1.25 million increased from 351 to 371 pending sales, a 6% increase and nearly the same level as a month ago. The luxury home inventory increased from 1,981 homes to 2,011, up 2%. Even with the increase in demand, the luxury market is NOT a robust seller’s market, taking months in order to find success.

For homes priced between $1.25 million and $1.5 million, the expected market time decreased from 108 to 96 days. For homes priced between $1.5 million to $2 million, the expected market time increased from 144 to 148 days. In addition, for homes priced above $2 million, the expected market time decreased slightly from 256 days to 253 days. At 253 days, a seller would be looking at placing their home into escrow around the end of February of next year.

Story and graphics compliments of Steven Thomas, QEDS

Orange County Housing Market Summary:

• The active listing inventory increased by 148 homes, or 3%, in the past couple of weeks, and now totals 5,905, knocking on the door of the 6,000 home level. Last year, there were 6,868 homes on the market, 963 more than today.

• There are 35% fewer homes on the market below $500,000 today compared to last year at this time and demand is down by 21%. Fewer and fewer homes and condominiums are now priced below $500,000. This price range is slowly disappearing.

• Demand, the number of pending sales over the prior month, increased by 1% in the past couple of weeks, adding 33 pending sales and now totals 2,937. The average pending price is $845,004.

• The average list price for all of Orange County remained at $1.6 million. This number is high due to the mix of homes in the luxury ranges that sit on the market and do not move as quickly as the lower end.

• For homes priced below $750,000, the market is HOT with an expected market time of just 39 days. This range represents 39% of the active inventory and 61% of demand.

• For homes priced between $750,000 and $1 million, the expected market time is 53 days, a hot seller’s market (less than 60 days). This range represents 18% of the active inventory and 20% of demand.

• For homes priced between $1 million to $1.25 million, the expected market time is at 84 days, a tepid seller’s market.

• For luxury homes priced between $1.25 million and $1.5 million, the expected market time decreased from 108 to 96 days. For homes priced between $1.5 million to $2 million, the expected market time increased from 144 to 148 days. For luxury homes priced above $2 million, the expected market time decreased from 256 to 253 days.

• The luxury end, all homes above $1.25 million, accounts for 34% of the inventory and only 13% of demand.

• The expected market time for all homes in Orange County increased from 59 days to 60 in the past couple of weeks, changing from a hot seller’s market to a tepid seller’s market (60 to 90 days). From here, we can expect the market time to slowly rise throughout the Summer Market.

• Distressed homes, both short sales and foreclosures combined, make up only 1.2% of all listings and 2.1% of demand. There are only 25 foreclosures and 46 short sales available to purchase today in all of Orange County, that’s 71 total distressed homes on the active market, 5 fewer than two weeks ago. Last year there were 138 total distressed sales, 94% more than today.

• There were 3,147 closed sales in May, an 18% increase over April 2017 and a 4% increase over May 2016. The sales to list price ratio was 97.8% for all of Orange County. Foreclosures accounted for just 1.1% of all closed sales and short sales accounted for 1.7%. That means that nearly 97.2% of all sales were good ol’ fashioned equity sellers.

Have a safe Holiday!

Sincerely,
Roy A. Hernandez
TNG Real Estate Consulants
Cell 949.922.3947

[gravityform id=”22″ title=”true” description=”true”]

Filed Under: Roy's Blog

OC Housing Report: Applying the Brakes

May 23, 2017 By Roy Hernandez Leave a Comment

Hello!

As housing transitions into the Summer Market, there are more
For Sale signs while demand softens.

The Summer Shift: The annual tradition is no different in 2017, housing is shifting from the Spring Market to the Summer Market. It is the season for commencement speeches, diplomas, and caps thrown into the air to mark the end of a chapter and the beginning of something new. Similarly, this is the season where the robust, hot Spring Market comes to an end, making way for a different market, a new chapter in local real estate, the Summer Market.

While the Summer Market may be the second busiest time of the year for real estate, sellers, buyers, and real estate professionals feel a palpable shift. The active listing inventory slowly and methodically grows from now through mid-August. At the same time, demand softens slightly from the peak of 2017, which occurred two weeks ago.

Many mistakenly think that right now is the absolute best time to come on the market. It is just not true. The best conditions actually occurred at the start of April when the expected market time hit a low. Since then, the expected market time has been slowly rising and will continue to rise from now through the 2017 peak in the active inventory, which typically occurs around mid-August.

Photo/Article courtesy of Steven Thomas.

This shift occurs because summer is full of distractions. From the beach, to the pool, to vacations, buyers’ attention is diverted a bit. Not to mention, the number one distraction, everybody’s kids are on summer break too. It’s just not as easy to see homes when the kids are not confined to their school classrooms.

Even though it will continue to be a seller’s market, overall housing is just about to move from a hot seller’s market to just a seller’s market. The stark difference in this market can be isolated to a bit less activity with not as many offers generated. This shift is much more dramatic in the higher price ranges, from $750,000 and up.

It may be a seller’s market, but sellers really need to approach pricing with extreme caution and care. For sellers who aggressively stretch their asking prices, they risk not being successful and missing both the Spring and Summer Markets. Arbitrarily picking a desired sales price and ignoring the closed and pending sales data is a recipe for disaster and a waste of valuable market time.

For example, a home that sold in December 2016 at $800,000 is not worth $900,000 today, over 12% higher. The market has been appreciating at about 5% annually. That means it takes 365 days for a home to appreciate 5%, not 3 months, not 6 months, not 9 months. It takes a year. On average in Orange County, that $800,000 home would be worth about $820,000, 6-months later. That is 2.5% more.

Additionally, it is worth mentioning that this simple example does not work for every property in every neighborhood. The appreciation rate varies from area to area, neighborhood to neighborhood, and sometimes from street to street. A professional REALTOR® can help dissect the recent closed and pending sales data to help establish the best price for success. Sellers absolutely should NOT utilize Zillow to price a home. Zillow admits it themselves, stating, “The Zestimate® is a starting point in determining a homes’ value and is not an official appraisal.” It is just an approximation and leads to inaccurate pricing. Nothing beats carefully looking at the comparable sales data and comparing the property size, bedrooms, bathrooms, location, amenities, upgrades, condition, lot size, and every other nuance that goes into the sale of a home.

The bottom line is this: the market is slowly cooling right now and the window of opportunity to find success prior to the kids going back to school at the end of August is beginning to close. Sellers find success through accurate pricing. Price out of bounds and risk losing valuable market time during the best time of the year to sell, the Spring and Summer Markets.

Active Inventory: The active inventory increased by 4% in the past couple of weeks.
The active listing inventory added an additional 236 homes in the past two-weeks, a 4% increase, and now sits at 5,623. Expect the inventory to continue to rise until it peaks around mid-August. Even though demand peaks in April to early-May, more homeowners come on the market in the month of June than any other time of the year. Since demand is not as strong, the active inventory grows. As more homes accumulate on the market, there is more seller competition.

Last year at this time, there were 6,267 homes on the market, 11% more than today.

Photo/Article courtesy of Steven Thomas.

Demand: Demand dropped by 3% in the past couple of weeks.Demand, the number of homes placed into escrow within the prior month, dropped by 98 pending sales in the past month, or 3%, and now totals 2,914. In both 2015 and 2016, demand eclipsed the 3,000 mark for two months, compared to just two-weeks this year. A major contributing factor to this year’s phenomenon is the lack of homes coming on the market in the lower ranges. In the last 30 days, there have been 21% fewer homes placed on the market below $500,000, and 11% fewer from $500,000 to $750,000.

We can expect demand to drop slightly from now through the upcoming summer months.

Last year at this time, there were 230 more pending sales totaling 3,144. Current demand is off by 7% compared to last year. The expected market time increased from 53 to 58 days in the past couple of weeks. Last year it was at 60 days, very similar to today.

Luxury End: Luxury demand dropped by 7% in the past couple of weeks while the inventory grew by 4%.
In the past two weeks, demand for homes above $1.25 million decreased from 398 to 369 pending sales, a 4% drop. The luxury home inventory increased from 1,887 homes to 1,965, up 4%. Similar to the rest of the market, demand is dropping for luxury homes while the luxury inventory continues to grow. There is already plenty of seller competition in the upper ranges.

For homes priced between $1.25 million and $1.5 million, the expected market time increased from 89 to 90 days. For homes priced between $1.5 million to $2 million, the expected market time increased from 134 to 162 days. In addition, for homes priced above $2 million, the expected market time increased from 198 days to 235 days. At 235 days, a seller would be looking at placing their home into escrow around mid-January of next year.

Photo/Article courtesy of Steven Thomas.


Orange County Housing Market Summary:

  1.  The active listing inventory increased by 236 homes, or 4%, in the past couple of weeks, and now totals 5,623. Last year, there were 6,267 homes on the market, 644 more than today.There are 35% fewer homes on the market below $500,000 today compared to last year at this time and demand is down by 26%. Fewer and fewer homes and condominiums are now priced below $500,000. This price range is slowly disappearing.
  2.  Demand, the number of pending sales over the prior month, dropped by 3% in the past couple of weeks, shedding 98 pending sales and now totals 2,914 , dropping below 3,000 a bit earlier than the past couple of years. The average pending price is $859,899.
  3. The average list price for all of Orange County remained at $1.6 million. This number is high due to the mix of homes in the luxury ranges that sit on the market and do not move as quickly as the lower end.
  4. For homes priced below $750,000, the market is HOT with an expected market time of just 37 days. This range represents 38% of the active inventory and 60% of demand.
  5. For homes priced between $750,000 and $1 million, the expected market time is 55 days, a hot seller’s market (less than 60 days). This range represents 19% of the active inventory and 20% of demand.
  6. For homes priced between $1 million to $1.25 million, the expected market time is at 65 days, a seller’s market.
  7. For luxury homes priced between $1.25 million and $1.5 million, the expected market time increased from 89 to 90 days. For homes priced between $1.5 million to $2 million, the expected market time increased from 134 to 162 days. For luxury homes priced above $2 million, the expected market time increased from 198 to 235 days.
  8. The luxury end, all homes above $1.25 million, accounts for 35% of the inventory and only 12% of demand.
  9.  The expected market time for all homes in Orange County increased from 54 days to 58 in the past couple of weeks, a solid seller’s market (less than 60 days), but about to transition into a normal seller’s market (60 to 90 days). From here, we can expect the market time to slowly rise throughout the Spring and Summer Markets, moving from a deep seller’s market to a slight seller’s market.
  10. Distressed homes, both short sales and foreclosures combined, make up only 1.2% of all listings and 2.5% of demand. There are only 31 foreclosures and 37 short sales available to purchase today in all of Orange County, that’s 68 total distressed homes on the active market, 13 fewer than two weeks ago. Last year there were 141 total distressed sales, 107% more; that’s more than double.
  11. There were 2,663 closed sales in April, a 5% decrease over March 2017 and a 3% decreased over April 2016. The sales to list price ratio was 98.6% for all of Orange County. Foreclosures accounted for just 0.8% of all closed sales and short sales accounted for 1.4%. That means that nearly 98% of all sales were good ol’ fashioned equity sellers

Have a great week.

Roy A, Hernandez
TNG Real Estate Consultants
949.922.3947
RoyaltyAgent@Gmail.com

Photos and article courtesy of Steven Thomas.

[gravityform id=”22″ title=”true” description=”true”]

Filed Under: Roy's Blog

  • « Previous Page
  • 1
  • 2
  • 3
  • 4
  • …
  • 11
  • Next Page »

RoyaltyAgent@gmail.com

Search All Houses FOR SALE

Hot Bank Foreclosures & REO

Current Mortgage Rates

[mlrates state="CA" size="narrow"]

Fullerton Homes FOR SALE by Price

$300,000- $500,000
$500,000- $700,000
$700,000- $900,000
$900,000- $1,100,000
$1,100,000 and above

Fullerton Condos FOR SALE by Price

$200,000- $300,000
$300,00- $400,000
$400,000 and above

Our Coverage Areas

Brea Homes FOR SALE

Brea North Hills FOR SALE

Whittier Homes FOR SALE

Fullerton Homes FOR SALE

Placentia Homes FOR SALE

La Habra Homes FOR SALE

Yorba Linda Homes FOR SALE

Anaheim Homes FOR SALE

Brea Special Events

Community Reports

downtown brea

City Information


Brea

Yorba Linda

Placentia

Fullerton

La Habra

Tag Cloud

Anaheim Hills real estate for sale Anaheim house for sale bank owned Brea bank owned for sale Brea community info Brea foreclosure for sale Brea house for sale Brea houses for sale Brea real estate Brea real estate for sale Brea REO Brea REO for sale buyer real estate news foreclosure for sale Fullerton house FOR SALE Fullerton houses for sale Fullerton real estate Fullerton Real Estate For Sale fullerton resort living housing data housing market housing news la habra houses for sale La Habra real estate for sale north orange county for sale north orange county real estate orange county housing info orange county real estate Orange county real estate for sale orange county shadow inventory placentia condos for sale placentia for sale placentia homes for sale placentia houses for sale placentia real estate real estate information real estate news orange county REO for sale REO property for sale seller information whittier houses for sale Yorba Linda for sale Yorba Linda homes for sale yorba linda houses for sale Yorba Linda real estate for sale
The Virtual Realty Group
Roy Hernandez
cell/text (949) 922-3947
RoyaltyAgent @ gmail.com
RoyalAgent.net
BRE#01202958
  • Blog Page
  • I’d like to sell my house
  • About

Copyright © 2025 Website by The Burrell Group · Log in