Hello!
When it comes to housing, everybody puts way too much emphasis on the price of a home when they should really be taking a closer look at the monthly payment.
Focus on the Payment: Just a year ago mortgage rates were at 4.75% and rising, substantially higher than today’s 3.5% rate. Everyone has done it. When it is time to look for a brand-new car, narrowing down the car of choice is the first step. After isolating the perfect car, the next step is to sit down and negotiate. Once the initial paperwork and credit application are complete, the salesperson leaves the negotiating table and visits privately with the manager. Upon their return, they then go over the payment for the car. After going back and forth to lower the monthly obligation by $20, it is not uncommon to get up and start calling around other dealers to see if a better payment is out there. After all, it will be the same monthly amount that will come out of the checking account for five-years!
In purchasing a home, buyers tend to focus a bit too much on the price of a home and do not consider enough the monthly payment. After settling on a home and closing, the price no longer matters, it is the payment that is withdrawn from the checking account every single month for 30-years. It happens 360 times for a home loan versus 60 for a car. As a society, why is so much time devoted to the monthly payment for a car and not a home?
Everybody is focusing on how high values are today. For detached homes they are up 60% in Orange County since bottoming in 2011. Homes appreciated significantly from 2012 through 2017. In June of 2017, values eclipsed the record peak reached prior to the Great Recession in June 2007. Since breaking the record, values have only increased slightly. Homes are not appreciating much at all in 2019. Many believe that home values are unaffordable and have reached a peak. That is what a lot of buyers are hoping for. That is simply not correct, home values have not yet peaked.
Many buyers are sitting on the sidelines and waiting… and waiting. They are trying to time the market. Yet, economists and prognosticators will attest that timing markets is next to impossible. As a result, many capable buyers have been permanently sitting on the sidelines rather than cashing in on an excellent opportunity.
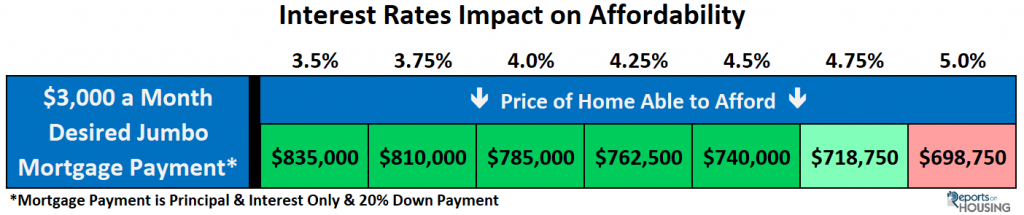
Housing is in a very good spot right now and it has everything to do with interest rates. In November of last year, the 30-year mortgage climbed all the way to 5%. Consequently, housing slowed to a crawl. But, since then rates have plummeted to 3.5%, that is down 30%. For a $700,000 loan, that is a $614 per month savings, or $7,373 per year. That is a HUGE savings!
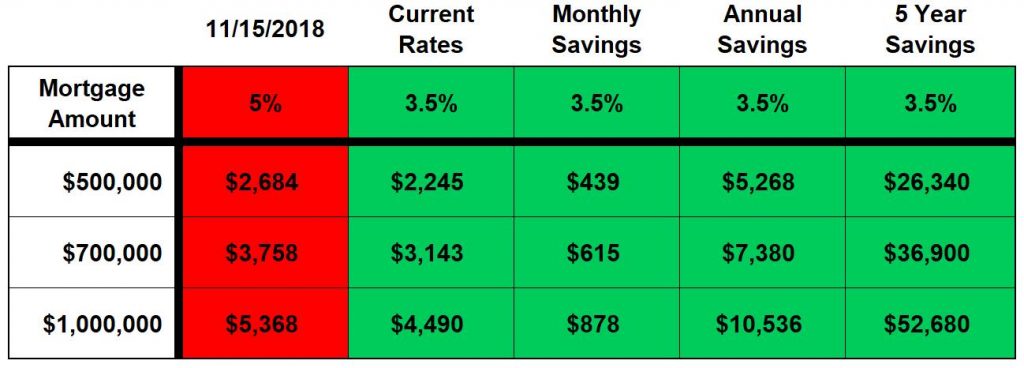
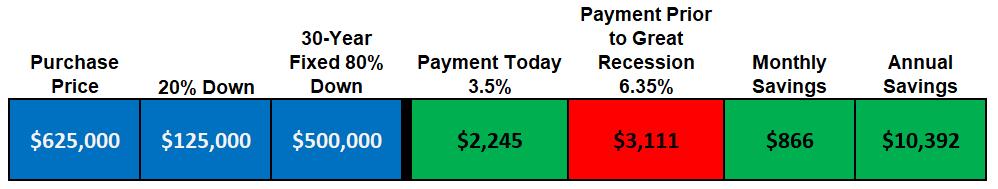
In digging a little deeper, prior to the Great Recession, mortgage rates were at 6.35% in 2007. A $625,000 home with 20% down had a monthly payment of $3,111 back then. Today at 3.5%, the monthly mortgage payment is only $2,245, an $866 per month savings, or over $10,000 per year! The difference is jaw dropping.
The giant savings are a result of excellent interest rates. They have been an absolute lift to housing this year and the momentum is slowly building. Homes are not unaffordable today like they were prior to the Great Recession. So, just because home values have returned to their prior recession levels, the current low interest rate environment is very good for housing. And, rates are not going to change much anytime soon.
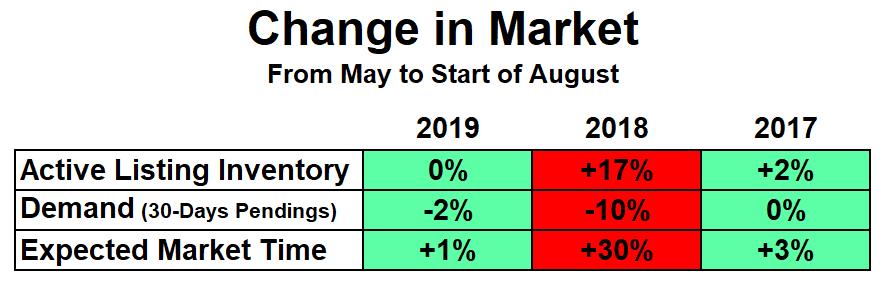
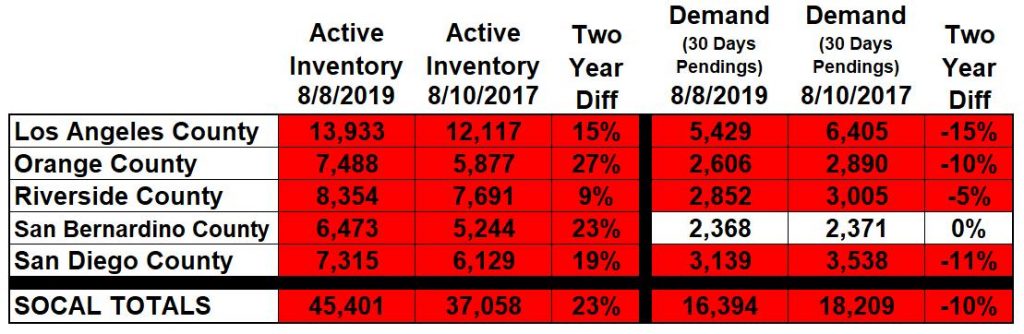
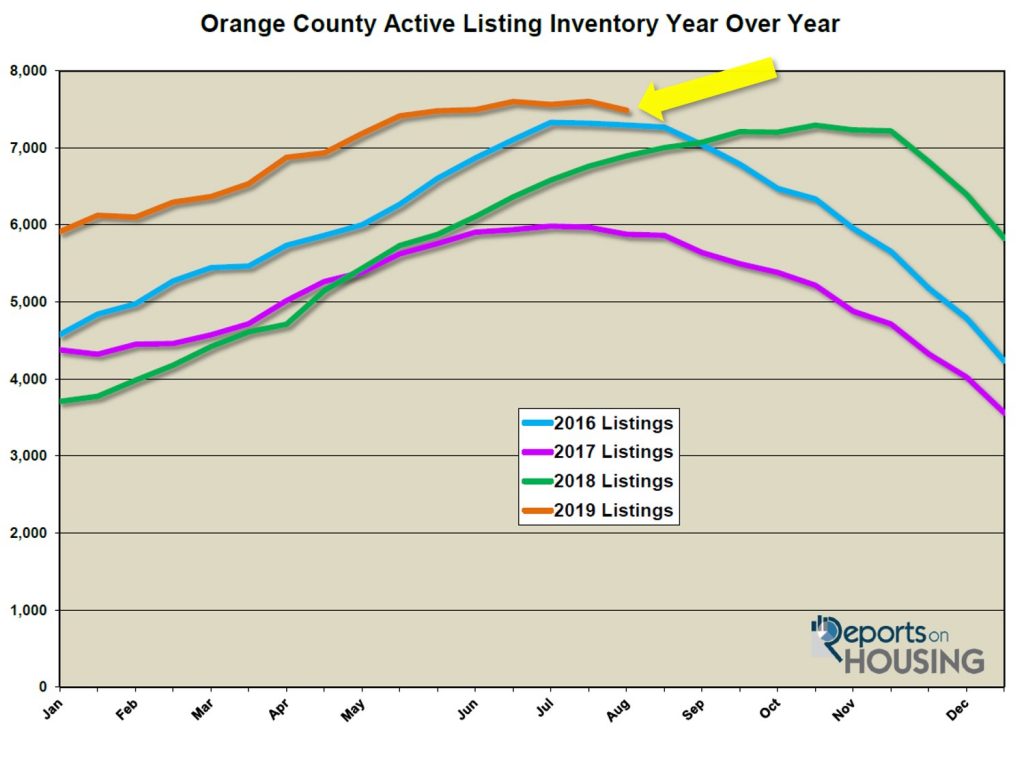
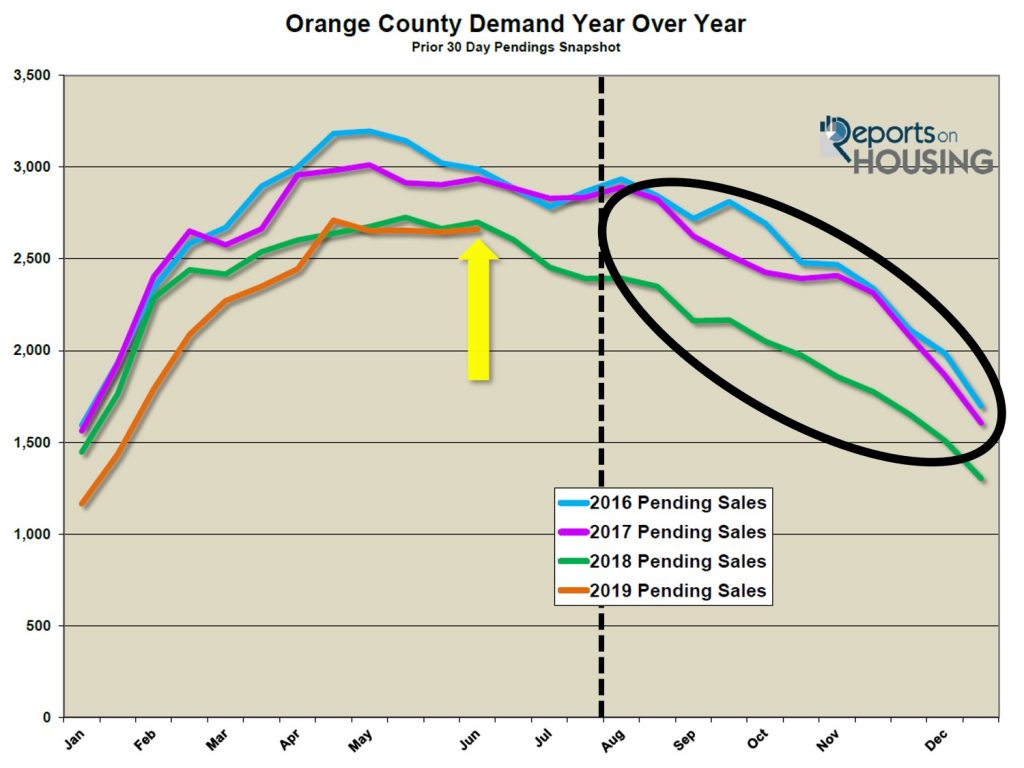
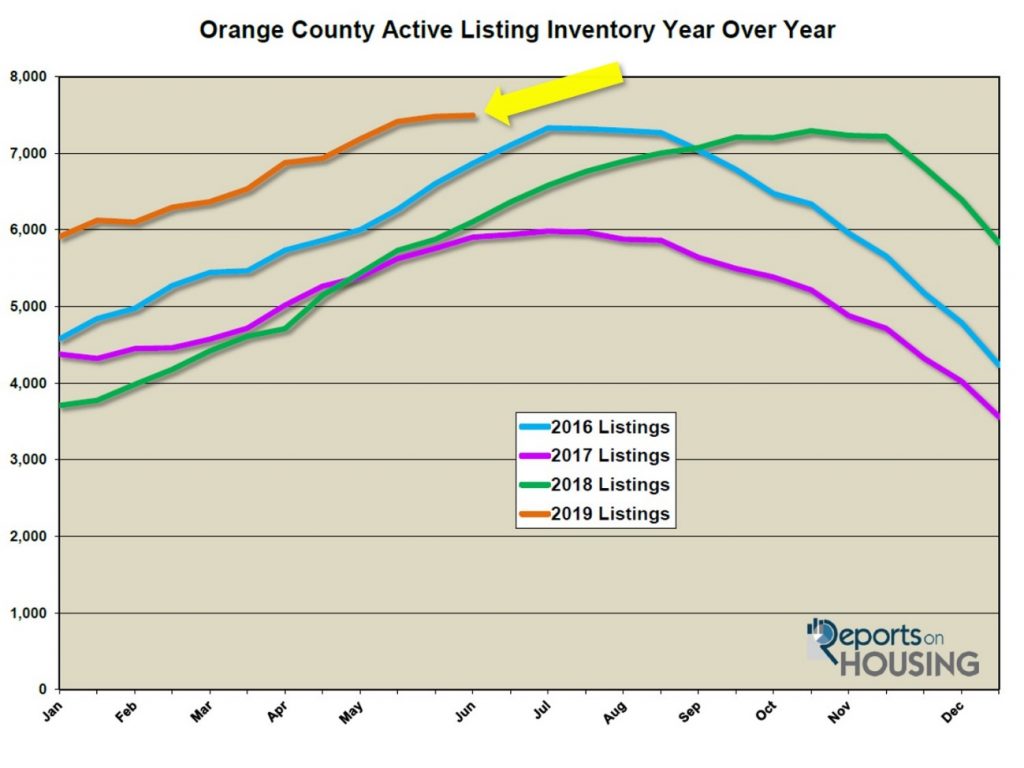
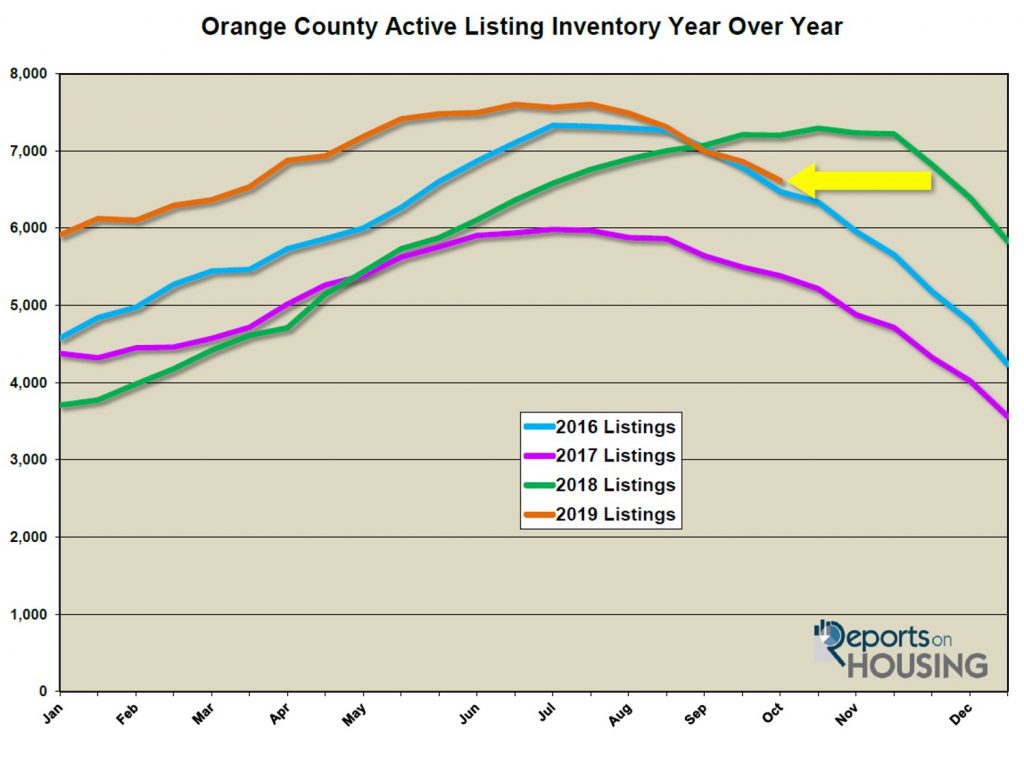
In Orange County, demand is up 13% year over year and the active inventory is down 8%. And, unlike last year, the inventory is dropping right now. It will continue to drop through the end of the year and 2020 will start with a lot fewer homes than the start to 2019. With lower rates, demand will be stronger at the beginning of 2020. As a result, the market will be a lot hotter than what everybody has become accustom to.
An important message for buyers: do not wait on the sidelines. Instead, cash in on these incredible rates now. An important fact to remember, buyers do NOT have to put 20% down to purchase a home. FHA financing allows buyers to buy a home with as little as 3.5% down.
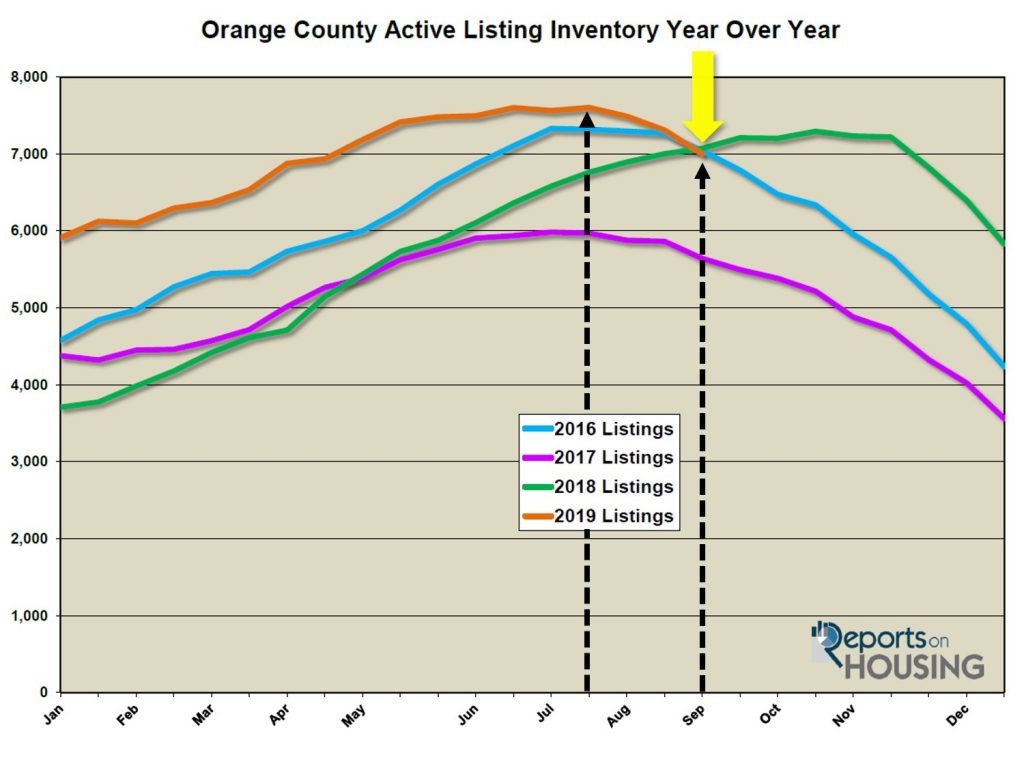
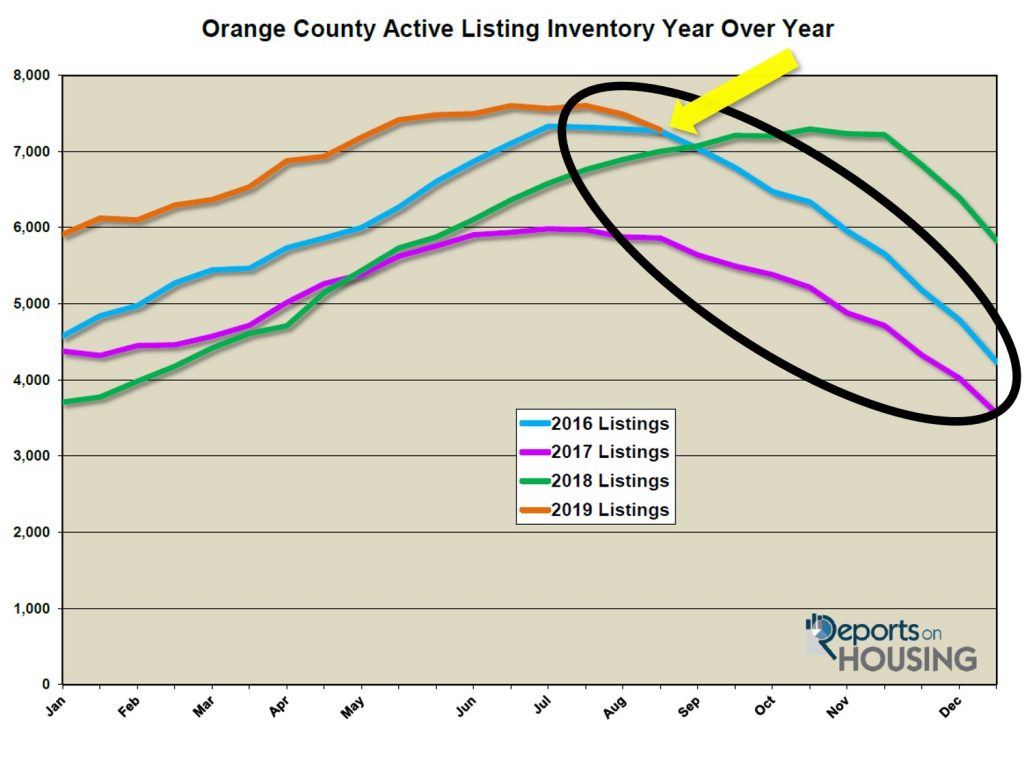
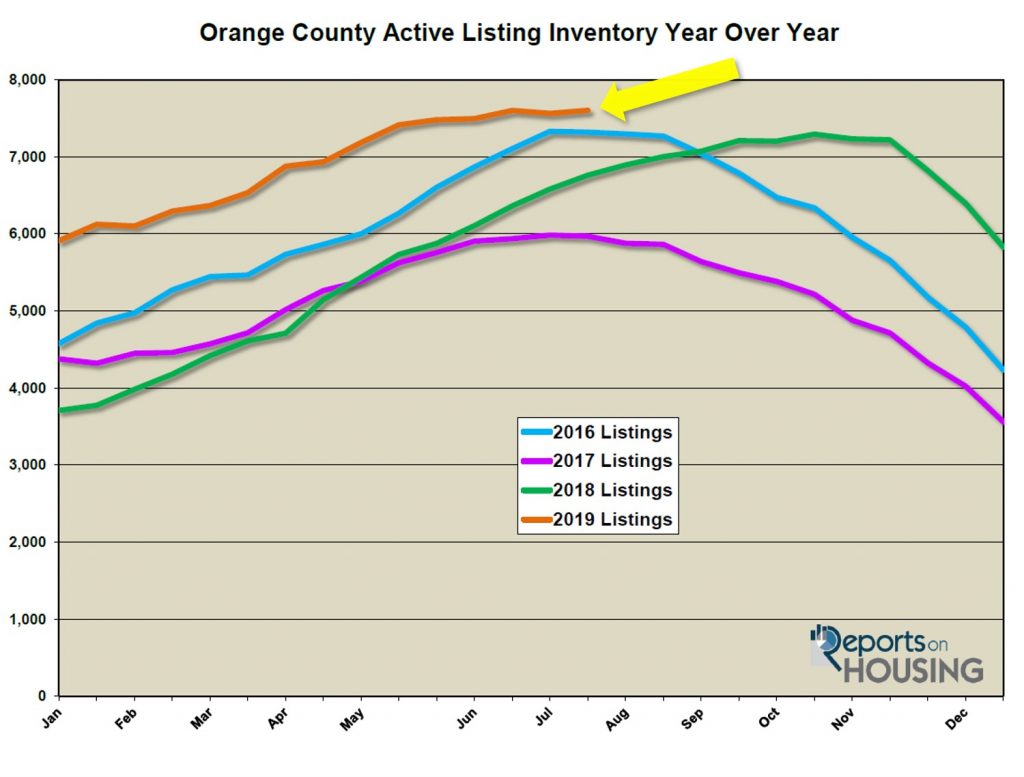
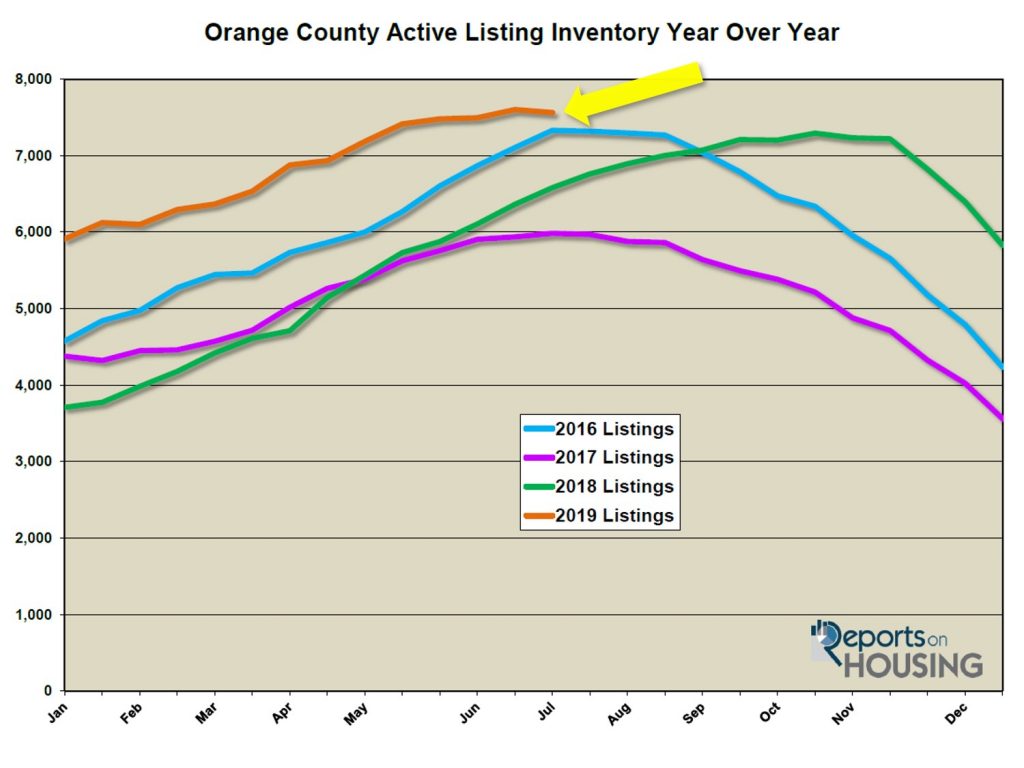
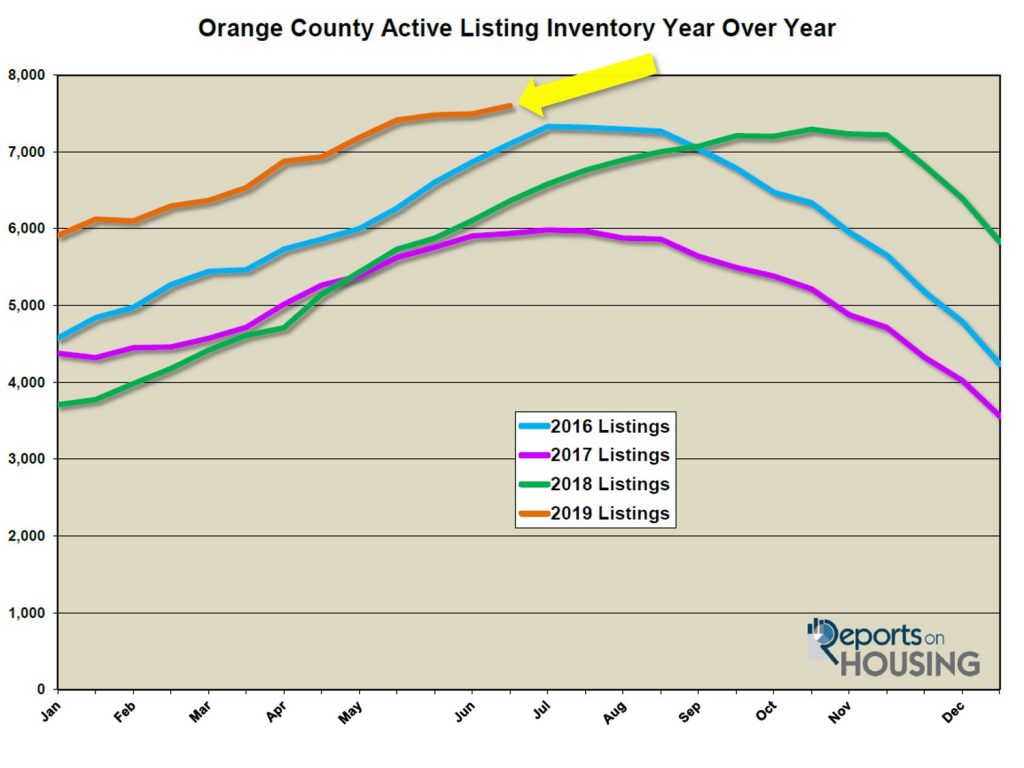
Active Inventory: The current active inventory dropped by 4% in the past two-weeks. In the past two-weeks, the active listing inventory dropped by 244 homes, down 4%, and now totals 6,616, levels not seen since March. There are fewer and fewer choices for buyers as fewer and fewer homes enter the fray. Many homeowners are waiting until next spring to place their homes on the market; and, many sellers are throwing in the towel now that both the Spring and Summer Markets are in the rearview mirror.
Last year at this time, there were 7,201 homes on the market, 585 more than today, or a 9% difference. The inventory is MUCH different than last year when it continued to rise through Thanksgiving.
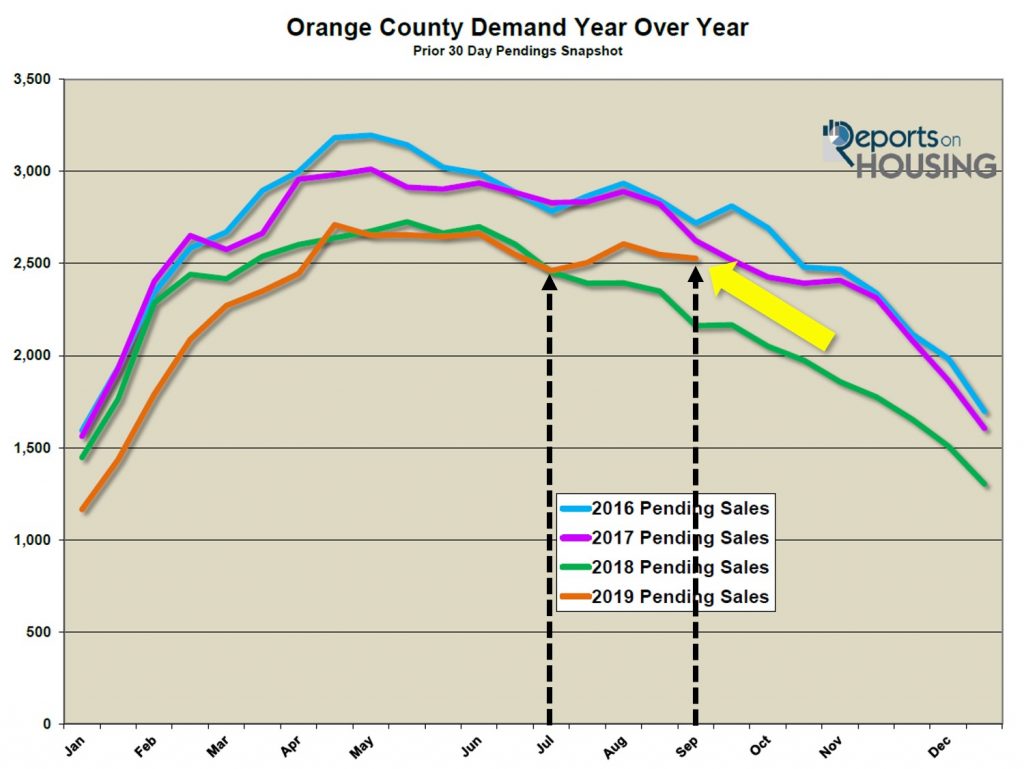
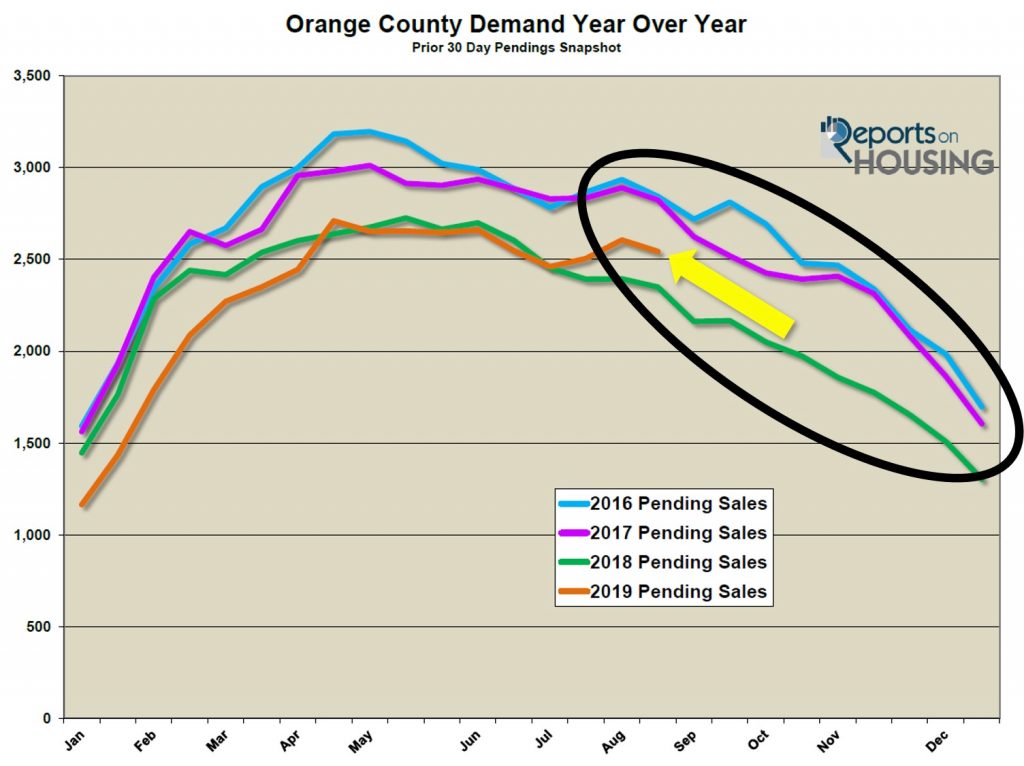
Demand: In the past two-weeks, demand dropped by 4%. Demand, the number of new pending sales over the prior month, dropped by 90 pending sales in the past two-weeks, a 5% drop, and now sits at 2,311. Demand will continue to drop for the remainder of the year and will rapidly drop after Thanksgiving, similar to the active listing inventory.
Last year at this time, there were 261 fewer pending sales than today, 11% less.
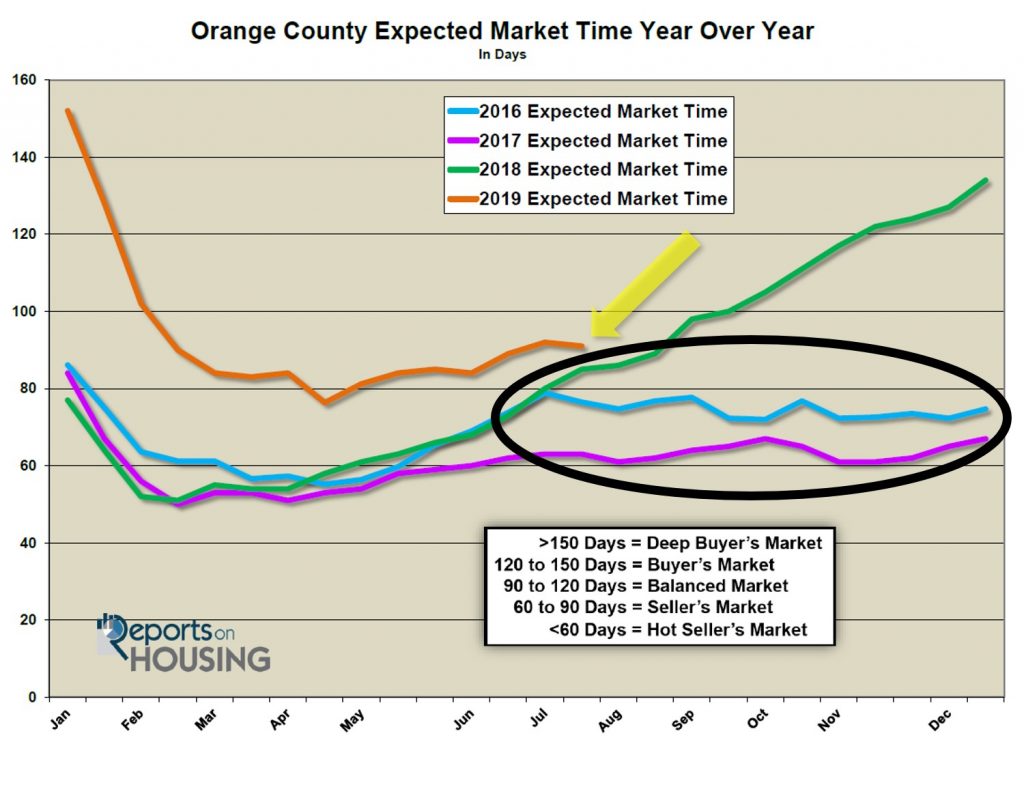
Since both supply and demand are falling at the same rate, in the past two-weeks the Expected Market Time remained unchanged at 86 days, a slight Seller’s Market (60 to 90 days), where home values do not change much, and sellers get to call more of the shots during the negotiating process. Last year, the Expected Market Time was at 105 days and rising, much slower than today.
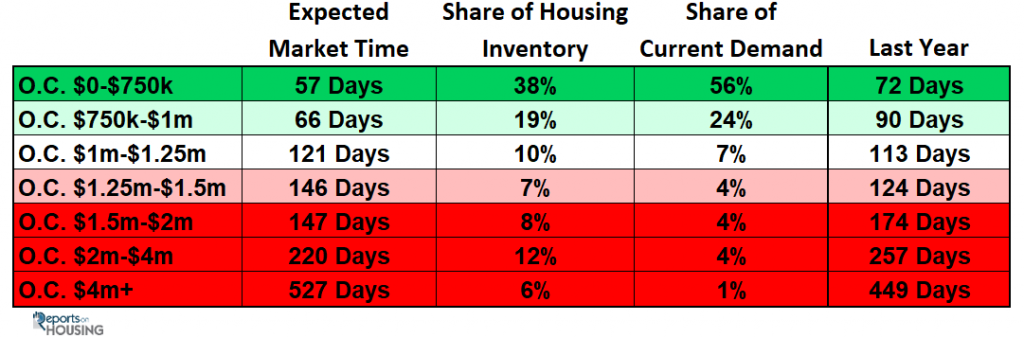
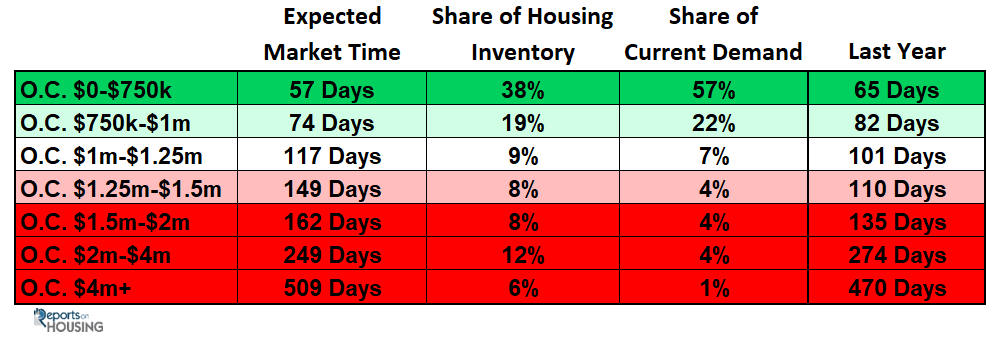
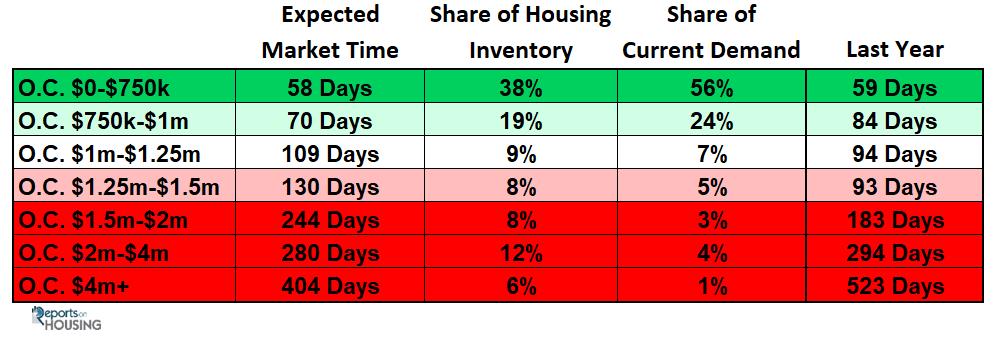
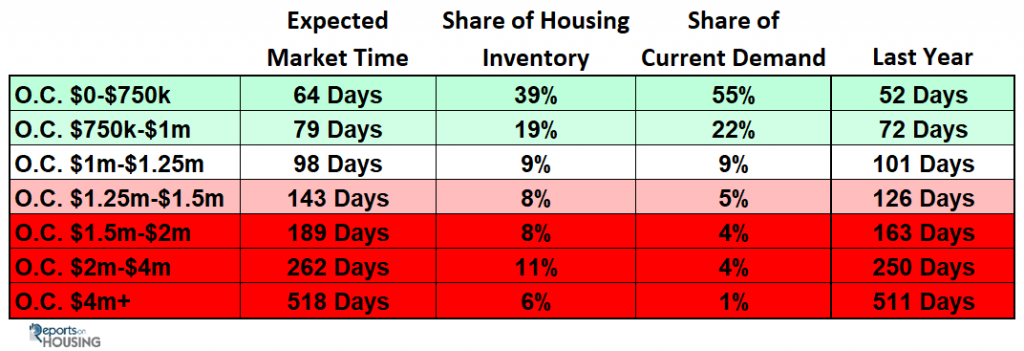
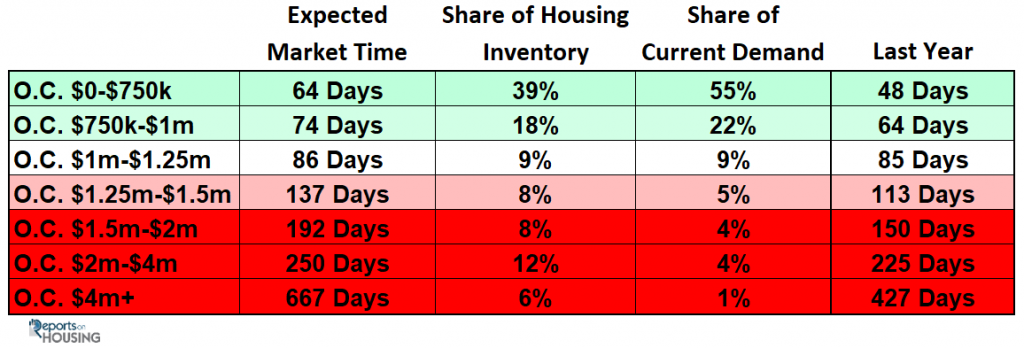
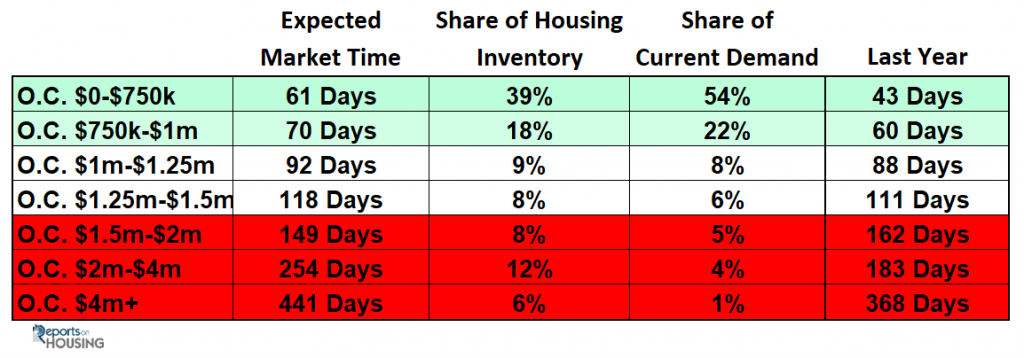
Luxury End: The luxury market continued to slow. In the past two-weeks, demand for homes above $1.25 million decreased by 25 pending sales, an 8% drop, and now totals 304. The luxury home inventory decreased by 81 homes and now totals 2,257, down 3%. The overall Expected Market Time for homes priced above $1.25 million increased from 213 days to 223 over the past two-weeks, a bit sluggish.
Year over year, luxury demand is up by 25 pending sales, or 9%, and the active luxury listing inventory is up by an additional 132 homes, or 6%. That may be more seller competition, but at least demand is stronger. The Expected Market Time last year was identical at 228 days, slightly slower than today.
For homes priced between $1.25 million and $1.5 million, in the past two-weeks, the Expected Market Time decreased from 136 to 121 days. For homes priced between $1.5 million and $2 million, the Expected Market Time increased from 155 to 171 days. For homes priced between $2 million and $4 million, the Expected Market Time increased from 278 to 332 days. For homes priced above $4 million, the Expected Market Time increased from 555 to 557 days. At 557 days, a seller would be looking at placing their home into escrow around April 2021.
Orange County Housing Market Summary:
- The active listing inventory decreased by 244 homes in the past two-weeks, down 4%, and now totals 6,616. Last year, there were 7,201 homes on the market, 585 more than today.
- Demand, the number of pending sales over the prior month, decreased by 90 pending sales in the past two-weeks, down 4%, and now totals 2,311. Last year, there were 2,055 pending sales, 11% fewer than today.
- The Expected Market Time for all of Orange County remained at 86 days, a slight Seller’s Market (between 60 to 90 days). It was at 105 days last year, a much slower market.
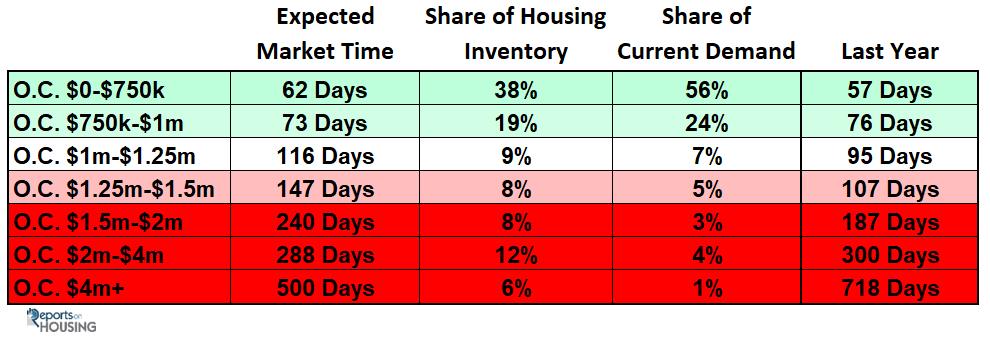
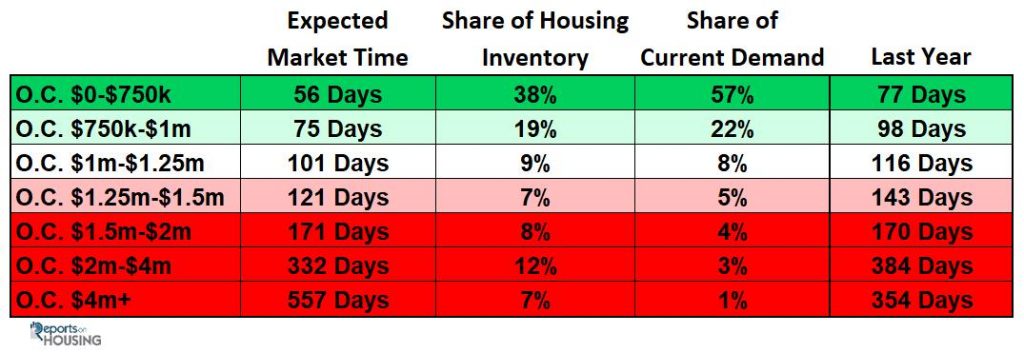
- For homes priced below $750,000, the market is a hot Seller’s Market (less than 60 days) with an expected market time of 56 days. This range represents 38% of the active inventory and 57% of demand.
- For homes priced between $750,000 and $1 million, the expected market time is 75 days, a slight Seller’s Market. This range represents 19% of the active inventory and 22% of demand.
- For homes priced between $1 million to $1.25 million, the expected market time is 101 days, a Balanced Market.
- For luxury homes priced between $1.25 million and $1.5 million, in the past two weeks, the Expected Market Time decreased from 136 to 121 days. For homes priced between $1.5 million and $2 million, the Expected Market Time increased from 155 to 171 days. For luxury homes priced between $2 million and $4 million, the Expected Market Time increased from 278 to 332 days. For luxury homes priced above $4 million, the Expected Market Time increased from 555 to 557 days.
- The luxury end, all homes above $1.25 million, accounts for 34% of the inventory and only 13% of demand.
- Distressed homes, both short sales and foreclosures combined, made up only 0.8% of all listings and 1.3% of demand. There are only 22 foreclosures and 32 short sales available to purchase today in all of Orange County, 54 total distressed homes on the active market, up one in the past two-weeks. Last year there were 78 total distressed homes on the market, a bit more than today.
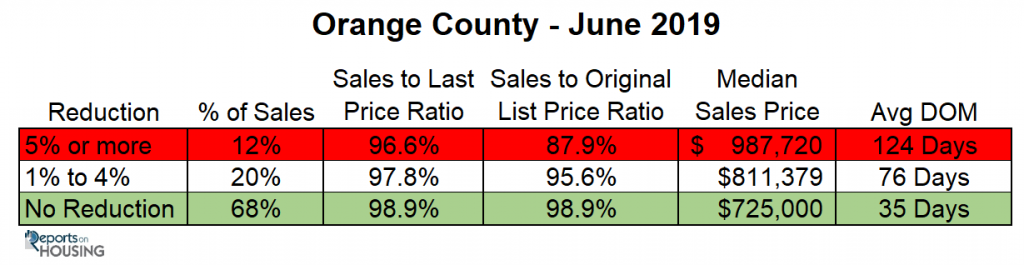
- There were 2,823 closed residential resales in August, 0.6% more than August 2018’s 2,806 closed sales. August marked a 2% drop compared to July 2019. The sales to list price ratio was 97.2% for all of Orange County. Foreclosures accounted for just 0.2% of all closed sales, and short sales accounted for 0.3%. That means that 99.5% of all sales were good ol’ fashioned sellers with equity.
Article courtesy of Steven Thomas, Quantitative Economics and Decision Sciences
Have a great week,
Roy Hernandez
Realtor
TNG Real Estate Consultants
949.922.3947

[ninja_form id=4]