• Home
  • Buyers
    • Buyer’s Guide
    • For Buyers
    • Buyer Wish List
  • Sellers
    • Seller’s Guide
    • For Sellers
    • Property Updates
    • Marketing & Listing Proposal 2019
    • Prepare your house For Sale
    • How much is my house worth today?
  • City Info
    • Search All Towns USA
    • Community Reports
    • Anaheim
    • Brea
    • Orange
    • Fullerton
    • La Habra
    • Placentia
    • Santa Ana
    • Yorba Linda
  • News
  • Schools
  • Contact Us

Roy Hernandez Real Estate Services

Orange county real estate houses for sale

You are here: Home / Blog Page

OC Housing Report: A Dive Into Housing Strengths

September 9, 2020 By Roy Hernandez Leave a Comment

Hello,

Buying or Selling Soon? Contact Roy First!
Experience the difference 25 years makes!

Roy’s Take: the low supply, strong demand, increased affordability, and a strong demographic patch all are the foundation of an exceptionally hot Autumn Market. It will feel like 2020’s Summer Market.

OC Housing Report: A Dive into Housing’s Strengths

The housing market is firing on all cylinders and it appears as if the Autumn Market is going to be the hottest in years.

Strong Fundamentals:

With a low supply, fierce demand, low mortgage rates, and a strong demographic of first-time buyers, the housing market is on strong footing. 

It is that time of the year. There are Halloween costumes at Costco. The kids are back in school, online for now. Mornings are a lot darker with the sun rising later. The official start to autumn is not until Tuesday, September 22, but signs are beginning to emerge that the seasons are about to change.

As for Orange County housing, the Autumn Market typically starts at the end of August when the kids head back to school. With the Spring and Summer Markets in the rearview mirror, many families back off their pursuit in purchasing a home. Similarly, fewer homeowners enter the fray and many unsuccessful sellers pull their homes off the market. With the kids back in school, the timing just is not the best for families. Moving can be disruptive while the kids are focusing on their education.

Yet, 2020 has been nothing close to ordinary or typical. What should have been the Spring Market, March through May, turned into one of the slowest springs in memory. The “Stay at Home” order and initial shock and anxiety of the Coronavirus kept buyers from buying and homeowners from selling. As the real estate industry adapted becoming an essential service, and the shock of the virus that included social distancing, sanitizing, and dawning a mask waned, housing surged. The Summer Market became the Spring Market in 2020. It appears as if the Autumn Market is going to be the Summer Market in 2020, not quite as hot as June, July, and August, but still quite busy with homes flying off the market and generating multiple offers. All signs point to an extraordinary September, October, and first half of November.

Supply and Demand: The active listing inventory is at its lowest August level since tracking began in 2004, and current demand is at its highest level since 2012. Year over year, the active inventory is down by 41% and demand (the number of pending sales over the prior month) is up by 30%. In taking a deeper look, the hottest price ranges are between $500,000 and $1 million. From $500,000 to $750,000, there are 927 fewer FOR-SALE signs compared to last year, 54% less, yet demand is up by 120, 13% more. Between $750,000 and $1 million, there are 606 fewer active
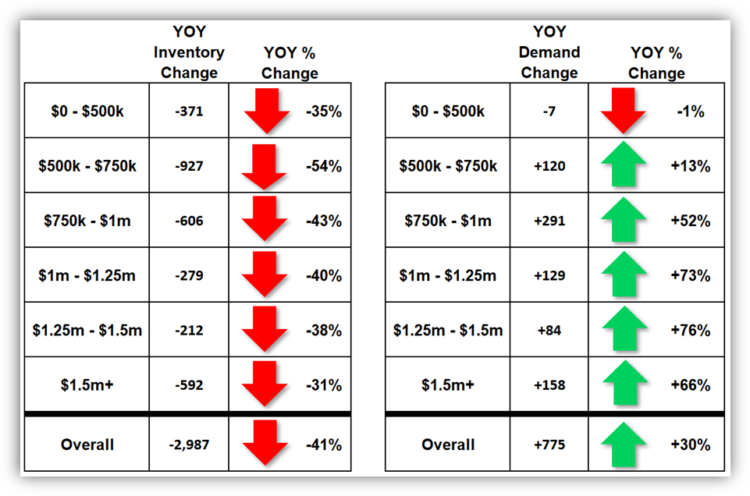
listings, 54% less, and demand is up by 291, 52% higher. These ranges have an Expected Market Time (the time between pounding in the FOR-SALE sign to opening escrow) that is less than 30-days, CRAZY HOT. The upper ranges are experiencing a diminished supply and extraordinarily strong demand. The only demand reading that is off is for properties priced below $500,000, with 7 fewer pending sales year over year, 1% less, yet there are 371 fewer active listings, down by 35%.

For Orange County, the low supply and feverish demand has paved the way for an overall Expected Market Time of 39 days, its lowest level of the year and the best reading since 2013. Anything below 60-days is considered a Hot Seller’s Market with tons of showing, multiple offers, and strong sales prices. Typically, the lowest point of the year occurs between March and April. For it to occur at the end of August is indicative of a strong Autumn Market to come. Any changes in the inventory and demand are customarily a slow evolution.

Affordability: Record low mortgage rates is fueling today’s remarkable demand. With rates dropping below 3%, it is having a significant impact on affordability. In taking into consideration the median income, the median sales price, and mortgage rates over time, according to the California Association of REALTORS® Housing Affordability Index, 25% of Orange County residence could afford the median sales price home during the 2nd quarter of 2020. Compare that to 2007 when it was at 11%. It was at 20% back in 2018 when mortgage rates reached 5%.

In diving a little deeper, a $700,000 mortgage at 3.94%, the average rate in 2019, yields a monthly payment of $3,317. It would be $2,951 per month given today’s 3% interest rate, a savings of $366 per month or $4,392 annually. Lower rates increase a buyer’s buying power and record low rates instigate demand and is an advertisement to purchase.

Demographics: Millennials have surpassed Baby Boomers as the largest living adult generation. The demographics are lining up that favor an increase in home buyer demand. More and more Millennials (ages 23 to 38) are reaching the average first time home buyers age of 32-years old. Millennials number 72.1 million, exceeding both Baby Boomers (ages 55 to 73) at 71.6 million and Generations X (ages 39 to 54) at 65.2 million. That means that housing is heading into a strong demographic patch of first-time home buyers, one that has not been seen since the Baby Boomers were in their prime 30-years ago. A stronger supply of first-time buyers means increased demand for years to come.

Active Listings

The current active inventory decreased by another 3% in the last two weeks.

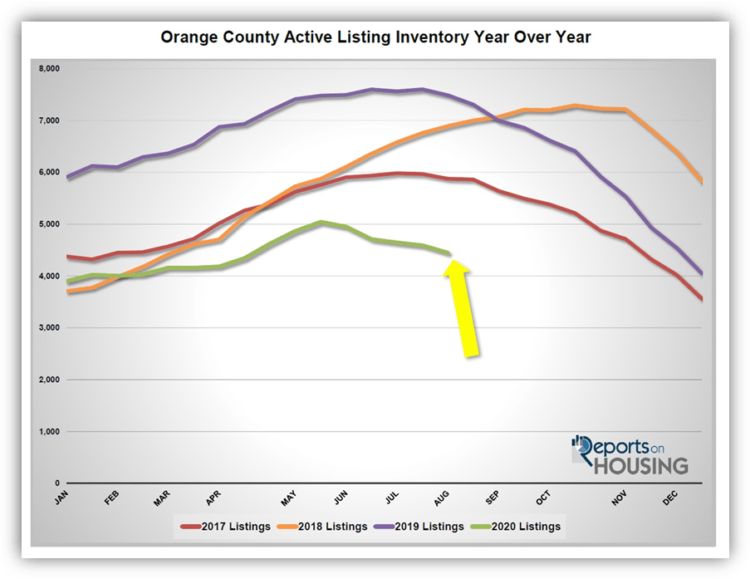
The active listing inventory shed 129 homes in the past two-weeks, down 3%, and now sits at 4,320, the lowest level for August since tracking began in 2004. COVID-19 is no longer suppressing homeowners from coming on the market; yet,
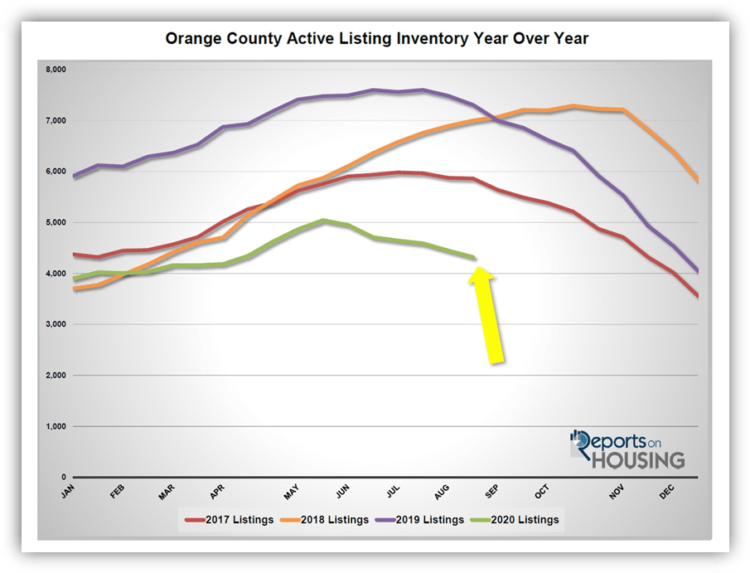
from May through June there were 27% fewer FOR-SALE signs compared to 2019, meaning 4,318 missing sellers. That has contributed to the current unprecedented low inventory. Based upon where the inventory is today, 2021 is going to start with a record low number of homes.

Last year at this time, there were 7,307 homes on the market, 2,987 additional homes, or 69% more. There were a lot more choices for buyers last year.

Demand:

Demand increased by 1% in the past two weeks.

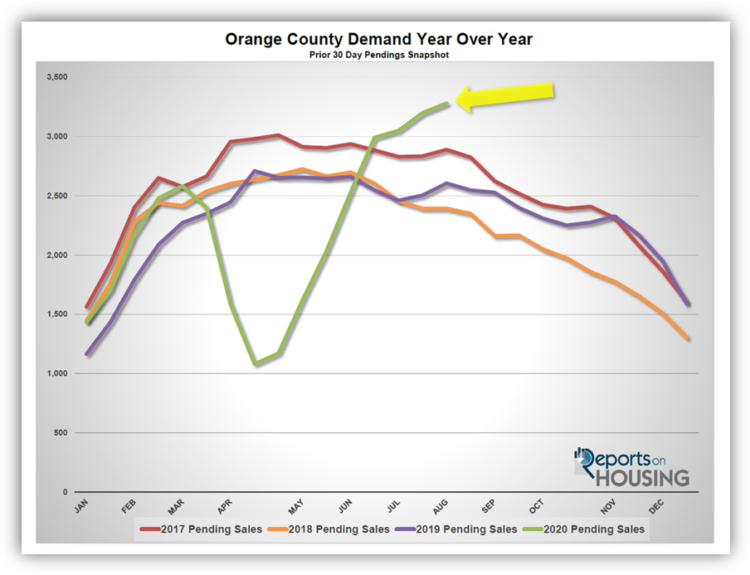
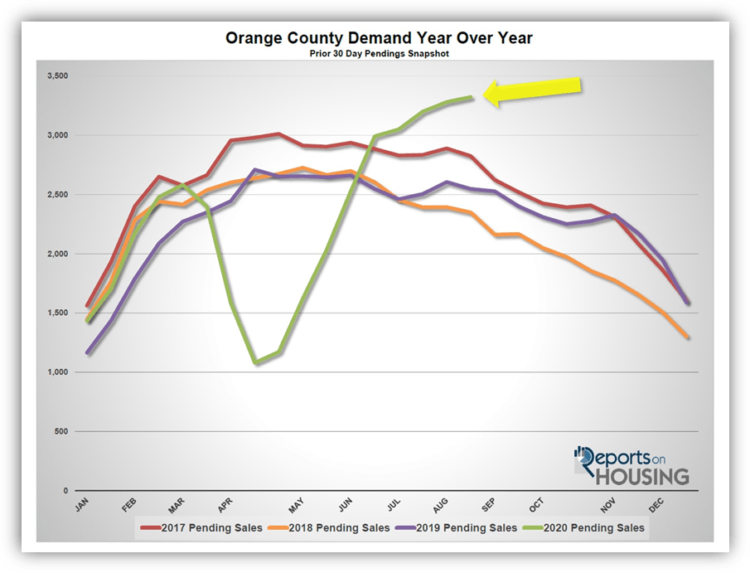
Demand, the number of new pending sales over the prior month, increased from 3,281 to 3,323, an additional 42 pending sales, up 1% in two weeks. This is the highest demand reading since September 2012, eight years ago. It is arguably higher today because back in 2012 there was a flood of short sales that were placed into escrow, yet many never closed. The closing percentages are greater this year as there are virtually no short sales.

Demand has not quite reached a height for 2020. We can expect demand to soften a bit as housing moves deeper into the Autumn Market, now through Thanksgiving, yet it will not slow as much due to the current low mortgage rate environment and continued pent up demand.

Last year, demand was at 2,548, that is 775 fewer pending sales compared to today, or 23% less.

In the past two-weeks the Expected Market Time dropped from 41 to 39 days, a Hot Seller’s Market (less than 60 days), where sellers get to call the shots during the negotiating process and home values are on the rise. This is the strongest level since June 2013. Last year the Expected Market Time was at 86 days, much slower than today.
Luxury End

The luxury market continued to improve with a drop in the supply and a rise in demand.

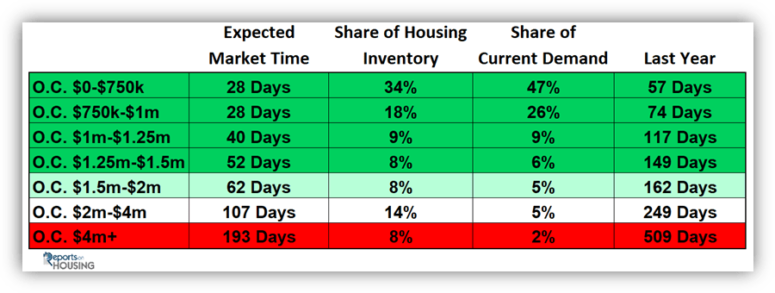
In the past two-weeks, demand for homes above $1.25 million increased by 16 pending sales, up 3%, and now totals 591. Luxury demand continues to be at its hottest level in years. It is not jumping to higher levels, but it is clawing its way higher and creating an even hotter luxury market. The luxury home inventory shed 54 homes, a 3% drop, and now totals 1,657. With a small rise in demand coupled with a slight drop in the supply, the overall Expected Market Time for homes priced above $1.25 million decreased from 89 to 84 days in the past couple of weeks. The luxury market continues to fire on all cylinders.

Year over year, luxury demand is up by 242 pending sales, or 69%, and the active luxury listing inventory is down by 804 homes, or 33%. The Expected Market Time last year was at 212 days, drastically slower than today.

For homes priced between $1.25 million and $1.5 million, in the past two-weeks, the Expected Market Time increased from 49 to 52 days. For homes priced between $1.5 million and $2 million, the Expected Market Time decreased from 68 to 62 days. For homes priced between $2 million and $4 million, the Expected Market Time decreased from 115 to 107 days. For homes priced above $4 million, the Expected Market Time decreased from 262 to 193 days. At 193 days, a seller would be looking at placing their home into escrow around March 2021.
Contact Roy for all your real estate needs!
Roy Hernandez 
“Your Trusted Partner in Real Estate”
TNG Real Estate Consultants
RoyaltyAgent@Gmail.com
949.922.3947
BRE#01202958

Filed Under: Roy's Blog, Uncategorized

OC Housing Report: Wave of Foreclosures??

August 20, 2020 By Roy Hernandez Leave a Comment

Hello,

Buying or Selling soon? Get the latest real estate news with ROY!

Read Roy’s take first!

Foreclosures accounted for just 0.4% of all closed sales, and short sales accounted for 0.2%. That means that 99.4% of all sales were good ol’ fashioned sellers with equity. Many fear a foreclosure wave, but I don’t think our government will be forcibly evicting people out of their homes. Not a good political move for either Democrats or Republicans. Foreclosures will increase and short sales will begin next year, but I don’t believe it’ll be a huge wave of foreclosures to hit the market. Look for banks and lenders to work out financing solutions with homeowners in order to keep folks in their homes.

See complete article below…….

OC Housing Report: Wave of Foreclosures?

Foreclosures and short sales have played an exceedingly small part in the housing market for years, yet many feel that is about to change.

The Distressed Market:

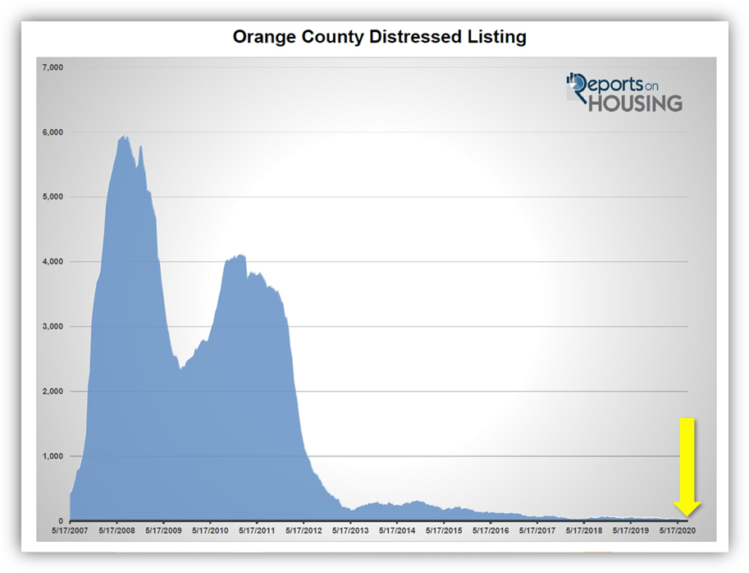
Foreclosures and short sales make up less than half a percent of the listing inventory and demand. 

Parents worry about their kids all the time. Often, their minds jump to the worst-case scenario. As their newly licensed teenager drives down the street solo for the first time, mom and dad are concerned that their inexperience could result in a devastating accident. Hiking as a family on one of Southern California’s many hilly trails often leads to unexpected sheer cliffs just feet away. Many parents visualize the potential for one of their children to lose their footing and slip to their peril. Parenting is full of anguish. To keep their kids safe, they, unfortunately, must consider the most severe outcome that can reasonably be projected to occur in every situation. Similarly, due to the recession, everybody is jumping to the worst-case scenario for housing, the inevitable wave of foreclosures to come.

It is crucial to immediately point out the simple fact that just because the economy is in the midst of a recession does not mean that the housing market will tank, values must go down, and many homeowners will lose their homes due to foreclosures or short sales. In fact, in the past five recessions, only two have led to declines in real estate values, the recession that began in 1991 and the Great Recession that started in 2008. Both were fueled by asset bubbles in housing that eventually popped. The recession in 1991 was powered by the savings and loan crisis. The Great Recession was driven by subprime lending and risky investments in mortgage securities. Thus, a wave of foreclosures ensued.

Today, there are only 11 foreclosures and 7 short sales to purchase in all of Orange County, that is 18 total distressed listings, the lowest level since initially tracking distressed listings began back in 2007. It represents only 0.4% of the active listing inventory and 0.4% of demand. Compare that to January 2009 when there were 5,104 distressed listings, 44% of the active listing inventory, and demand (the last 30-days of pending sales) was at 1,428 pendings, 67% of total demand.

That meant that two-thirds of all escrows were distressed. Lenders were in control of the market, either through bank owned listings, foreclosures, or short sales where the lender (or lenders) needed to approve taking less than the outstanding loan balance.

Today, the supply of homes to purchase is low, demand is high, and home values are on the rise. Multiple offers are once again the norm. Homes are flying off the market and into escrow. And, tight lending qualifications continue to be the bedrock and strength of housing.

Even with the strength, many homeowners are worried that the housing market will tank again, and a wave of foreclosures will inevitably follow. This stems from remembering the burn from the Great Recession. Everybody was either burned or knew someone who was hurt by the collapse in housing prices. The economy ground to a halt and unemployment grew to levels last seen at the beginning of the 1980’s. With COVID-19, the economy stopped and unemployment spiked to levels not seen since the Great Depression. As a result, everyone is jumping to the worst-case scenario in their collective minds: housing must suffer.

The current recession is unprecedented. Recessions occur due to a weakness in one area of the economy that is preceded by an implosion of an asset bubble. However, the current COVID-19 recession was instigated by a forced stop of the economy, which allowed United States citizens the ability to hunker down and flatten the curve in the spread of the Coronavirus. It was the pandemic that caused the recession and not a single sector of the economy. This is precisely why the recovery has been distinctly different than a customary recovery. Housing has seen a “v-shaped” recovery, and so has manufacturing and retail sales.

A closer look at unemployment illustrates that it is affecting the lower wage earners. According to the Wall Street Journal, Bureau of Statistics, employment has only dropped 2% since December 2019 for those with bachelor’s degrees. For 16 to 24-year old’s, employment has dropped by 20.6%. Restaurants, movie theaters, amusement parks, and many retail stores have been hit hard. Younger workers have been hit the hardest. Younger, lower wage earners are not homeowners.

There are about 4 million homeowners in active forbearance, which is 7.5% of all active mortgage. Of all current forbearances which are past due on their mortgage payment, 77% have at least 20% equity in their homes, and 90% have at least 10% equity. Upon exiting forbearance, homeowners can negotiate a payment plan to pay back the missed mortgage payments or defer the payments to the back end of their loans. If they are continuing to experience a hardship and are forced to sell, most will have plenty of equity to tap into that will allow them to sell, avoiding the short sale or foreclosure route.

With about 10% of homeowners in forbearance with less than 10% equity, those owners are vulnerable to becoming a distressed sale if they experience a financial hardship. That amounts to approximately 400,000 homeowners. But not all 100% will suffer this fate. Also, with values on the rise, their equity positions will increase in time. Some will not be able to avoid becoming a foreclosure or short sale statistic, but that is a 2021 story. It will be more of ripple in the market than a wave.

The bottom line: do not count on a wave of foreclosures or short sales due to the economic fallout of the COVID-19 recession. While there may be a bit more distressed in 2021, a slight rise, it will pale in comparison to the Great Recession. Nobody should expect any type of a deal anytime soon, especially with mortgage rates that dipped below 3%, reaching yet another record low.

Active Listings

The current active inventory decreased by 3% in the last two weeks.

The active listing inventory shed 141 homes in the past two-weeks, down 3%, and now sits at 4,449, the lowest level for August since tracking began in 2004. The active inventory reached a peak back in May at 5,044 homes and has dropped by 12% since. Expect the active inventory to continue to slowly drop from here and pick up steam during the holidays. It appears as if 2021 is going to start at a record low level.

In July, there were 2% more homes placed on the market compared to last year, and it was identical to the 5-year average. COVID-19’s grip on suppressing the inventory has finally vanished.

Last year at this time, there were 7,488 homes on the market, 3,039 additional homes, or 68% more. There were a lot more choices for buyers last year.

Demand

Demand increased by 3% in the past two weeks.

Demand, the number of new pending sales over the prior month, increased from 3,200 to 3,281, an additional 81 pending sales, up 3% in two weeks. This is the highest demand reading since September 2012, eight years ago. Demand customarily reaches a peak between April and May, but due to COVID-19 freezing the market in April, the incredible Spring Market activity was pushed to the Summer Market. The velocity of this current market is unprecedented for the summer months. Once the kids go back to school later this month, anticipate demand to slowly drop. It may not be as large of a drop due to record low mortgage rates and the ability for families to move more readily with online learning.

Last year, demand was at 2,606, that is 375 fewer pending sales compared to today, or 21% less.

In the past two-weeks the Expected Market Time dropped from 43 to 41 days, a Hot Seller’s Market (less than 60 days), where sellers get to call the shots during the negotiating process and home values are on the rise. This is the strongest level since June 2013. Last year the Expected Market Time was at 86 days, much slower than today.

Luxury End

The luxury market continued to improve with a drop in the supply and a rise in demand.

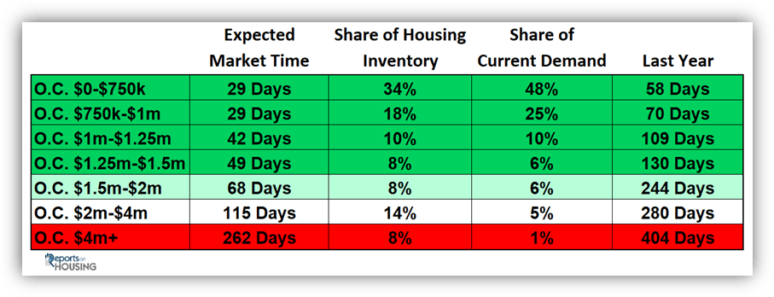
In the past two-weeks, demand for homes above $1.25 million increased by 9 pending sales, up 2%, and now totals 575. Luxury demand remains elevated at unprecedented levels. Demand is not growing as much and should reach a peak very soon, but it appears that it will remain at a strong level. The luxury home inventory shed 59 homes, a 3% drop, and now totals 1,711. With a small rise in demand coupled with a slight drop in the supply, the overall Expected Market Time for homes priced above $1.25 million decreased from 94 to 89 days in the past couple of weeks. The luxury market remains healthy and strong.

Year over year, luxury demand is up by 244 pending sales, or 74%, and the active luxury listing inventory is down by 796 homes, or 32%. The Expected Market Time last year was at 227 days, drastically slower than today.

For homes priced between $1.25 million and $1.5 million, in the past two-weeks, the Expected Market Time decreased from 53 to 49 days. For homes priced between $1.5 million and $2 million, the Expected Market Time decreased from 81 to 68 days. For homes priced between $2 million and $4 million, the Expected Market Time increased from 109 to 115 days. For homes priced above $4 million, the Expected Market Time decreased from 274 to 262 days. At 262 days, a seller would be looking at placing their home into escrow around April 2021.

Experience the difference 25 Years in real estate sales can make!!
Contact Roy for all your real estate needs!
Roy Hernandez 
“Your Trusted Partner in Real Estate”
TNG Real Estate Consultants
RoyaltyAgent@Gmail.com
949.922.3947
BRE#01202958
Article courtesy of Steven Thomas, Quantitative Economics and Decision Sciences
 

Filed Under: Roy's Blog

How to Move While Social Distancing

August 8, 2020 By Roy Hernandez Leave a Comment

Hello,
    What does your summer have in store? Are you getting ready to move to a new home or just looking for ways to help keep your family healthy as cold and flu season approaches? Find tips to help you manage your goals this summer below.

How to Move While Social Distancing

Summer is one of the most popular times to move, but how do you gather your friends, family, or hired movers together safely while practicing safe social distancing? Whoever you recruit to help move your belongings from point a to point b, here are some tips to help you and your family stay safe.

Provide Essentials. Make sure you have soap, water, hand sanitizer, masks, gloves, and shoe covers available during your move. These items, when used correctly, can help prevent the spread of germs.

Set Some Ground Rules. Whether the people helping you move are there as volunteers or earning a living, you should take charge and outline basic precautions you want everyone to use. Ask your helpers to wear a mask, wash or sanitize their hands often, and stay 6 feet apart whenever possible.

Use New Boxes Experts estimate that cardboard can carry COVID-19 for 24 hours, so it may be best to invest in new boxes instead of opting for used boxes for your next move. You can purchase moving boxes from most moving or storage companies.

Sanitize Before and After the Move Sanitize your furniture, boxes, and household touch points before your moving help arrives to help create a safe moving environment. You should also sanitize these items after unloading them at your new house.

What You Need to Know about Gift Letters

Buying a house can involve a lot of up front expenses. It can be hard to save up enough cash to cover inspections, closing costs, and down payments all on your own, especially while paying other expenses such as rent, student loans, and car payments. It’s not uncommon for loved ones to offer to help ease the financial burden, but before you accept cash to help buy your home, you’re going to need a gift letter.

Gift letters are documents stating that someone, often a parent or other family member, is giving a mortgage applicant money to help them purchase a home. The gift letter will typically include who is giving the money, who is receiving the money, the amount being gifted, and a statement declaring that the sum is being given with no expectation of the money being repaid.

The gift letter shows your mortgage lender where that money came from and lets them know that the gifter will not be able to claim they are a lender, and therefore cannot issue a lien on the property.

If you are planning to use gifted funds to help purchase your next home, make sure your lender is aware sooner, rather than later.

Protecting Your Family During Cold and Flu Season

You may already have your home’s sanitation plan up and running, but if not, here are some easy tips to help keep your home spic and span during cold and flu season.

Clean Common Touch Points Often! Some of the most commonly touched places in your home may be ones that aren’t on your cleaning list. Make sure door handles, stair railings, light switches, faucet handles, and drawer pulls are being cleaned at least as often as your tables and countertops.

Don’t Share. Sharing doesn’t always mean caring. Make sure everyone in the household is using their own cups and utensils for eating and drinking. Also, make sure no one’s toothbrushes are touching to prevent the spread of germs.

Wash Overlooked Items Purses, backpacks, shoes, and other items that make frequent trips outside your home should be washed or sanitized to ensure they aren’t harboring germs, viruses, or bacteria. Other overlooked items that could use some sanitizing include your phone, tablet, keyboard, remotes, and other electronic devices. Just remember to use an electronic safe cleaning pad to wipe down those surfaces to avoid damaging your devices.

Whatever your plans look like this month, I wish you the best! And, remember, if you or someone you know is looking to buy or sell a home, let me know. I’m here to help.

Blessings in 2020.
Roy Hernandez 
“Your Trusted Partner in Real Estate”
TNG Real Estate Consultants
Realtor@RoyalAgent.net
949.922.3947
BRE#01202958
 

Filed Under: Roy's Blog

OC Housing Report: Demand is Rising!

May 8, 2020 By Roy Hernandez Leave a Comment

Hello Friend,
Hope you’re doing well!
Here is what I’m seeing in the real estate market today!
a. The typical robust Spring market having been supressed by COVID-19, will now flourish in months of MAY, JUNE, JULY.
b. Buyers are adapting as well and looking for homes again, the market is waking up.
c. Good time to buy is NOW before demand becomes overwhelming for many qualified buyers.
d. Demand (the number of pending sales over the prior 30-days) increased by 9% in the past two weeks.
e. Expect buyer demand to continue to rise going forward, especially with the added inventive of record low mortgage rates.
f. With unprecedented record low interest rates (Avg. 3.23%), it’s hard to ignore the impact on affordability. 
g. Active inventory is low because of CV, yet there are signs inventory is increasing-worst is behind us.
For complete article, See below….

Buyer demand reached a bottom a couple of weeks ago, and now it is on the rise.
Rising Demand: Demand rose 9% even though “stay at home” orders have not yet been lifted  After seven weeks of staying at home, everybody is figuring out ways to make life feel a bit more normal again. DoorDash is on the go delivering food from local favorite restaurants. Church service is now streaming live with the ability to hit pause if the two-year old is acting up. With Zoom meetings all week long, working from home in t-shirts and shorts is not a bad way to get a lot accomplished. The kids are busy cyber learning in their online classrooms. Everybody is adapting to a new way of life. Buyers are adapting as well and are looking for homes again, the market is waking up.
After reaching a low two weeks ago, Orange County had dropped to inherent, natural demand last seen during the start to the Great Recession. Yet, in the past couple of weeks a change was afoot. Reports from the real estate trenches of increased showings and buyers writing offers again were repeated all over the county. Buyers are figuring out that they can still purchase a home in the middle of California’s “stay at home” order.
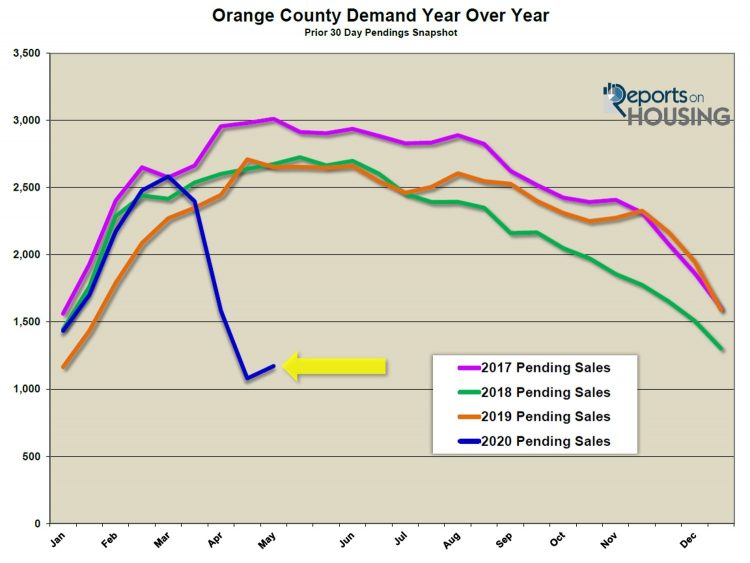
 The real estate industry has adapted to selling homes in this new COVID-19 environment. Buyers view properties wearing protective face masks and disposable, rubber gloves while respecting proper social distancing protocol. Everything else is done electronically, from a list of properties to a comparable market analysis to real estate contracts that grant buyers permission to view and purchase properties. As a result, it is not surprising that demand (the number of pending sales over the prior 30-days) increased by 9% in the past two weeks, growing from 1,080 to 1,172 pending sales.

It appears as if the shock of COVID-19 and its impact on demand bottomed two weeks ago and is now on the rise. Expect demand to continue to rise going forward, especially with the added inventive of record low mortgage rates. In fact, they reached an all-time low last week, dropping to an average of 3.23% across the country. With lower rates, homes become much more affordable.

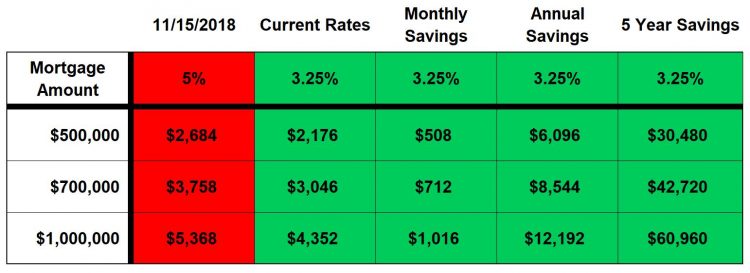
For example, in looking at a $700,000 mortgage, the monthly payment at 3.25% is $3,046 per month. That is a $712 per month savings, or $8,544 per year, compared to where rates were in November 2018, just a year-and-a-half ago. The savings are staggering, which helps explain why demand is starting to rise. It is hard to ignore the impact on affordability as rates hit these unprecedented levels.

Even with the large increase in demand over the past couple of weeks, demand is still muted. Its current level was last seen in January 2018, a snapshot of what happens to the velocity of pending sales when rates rose to 5%. Demand is also off by 56% compared to last year. So, COVID-19 is absolutely suppressing demand.

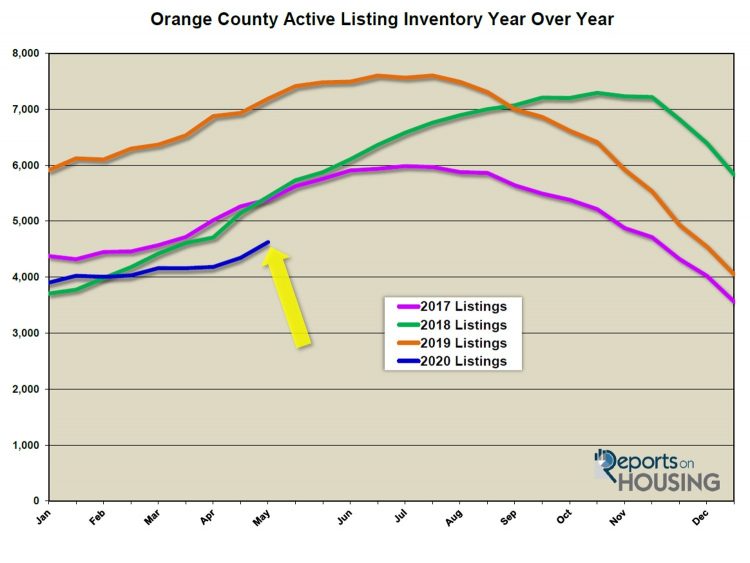
Within the last couple of weeks, the inventory grew by 6%, adding 281 homes, and it now totals 4,625. Yet, COVID-19 is also suppressing the active listing inventory. 54% fewer homes were placed on the market within the last four weeks compared to the 5-year average, 1,807 homes versus 3,889.

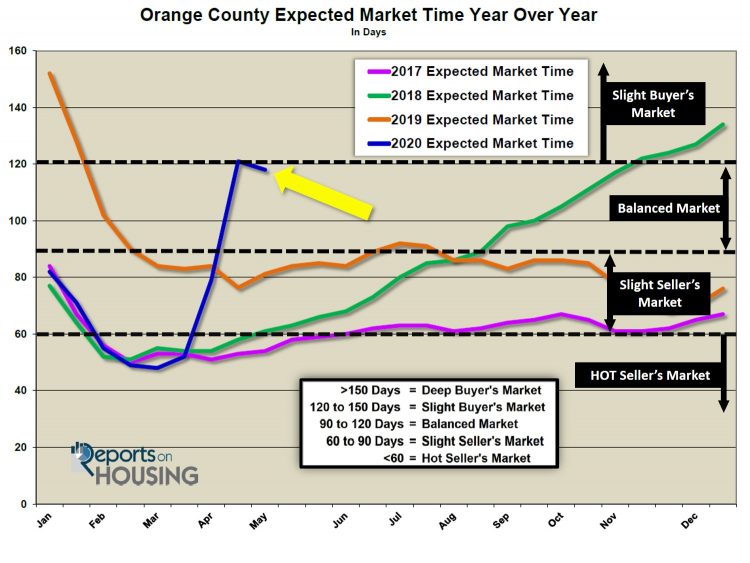
With demand increasing at a faster pace than the supply of homes, the Expected Market Time (the amount of time from hammering in the FOR SALE sign to opening escrow down the road) dropped from 121 days to 118 days, a Balanced Market (between 90 and 120 days). A Balanced Market does not favor buyers or sellers and home values do not change much at all. It is the first drop in the Expected Market Time since the start of the “stay at home” order back in March. From here, expect demand to continue to outpace any increase in the supply. As a result, the Expected Market Time will continue to drop in the coming weeks.

For buyers in Southern California, the current environment may prove to be the best time to jump on purchasing a home given that there is no rush to act immediately and rates are at all-time lows. That may change as California’s economy is slowly opened back up. Even so, it will not be business as usual. The new adaptation to selling homes in this COVID-19 environment will continue.

The market may not be firing on all cylinders like it was in February and the start of March when homes were flying off the market and obtaining multiple offers, but it is starting to turn a corner with both demand on the rise and the Expected Market Time falling for the first time in a couple of months.

Active Inventory: The current active inventory increased by 6% in the past two-weeks. The active listing inventory increased by 281 homes in the past two-weeks, up 6%, and now sits at 4,625. It is the largest increase so far this year. Yet, the current level is at the lowest level for this time of the year since 2013. There are still not that many homes on the market as COVID-19 is suppressing the number of homeowners entering the fray. In the past 4-weeks, there were 54% fewer new FOR SALE signs compared to the prior 5-year average. Expect this to continue until the economy is reopened down the road.

Last year at this time, there were 7,185 homes on the market, 2,560 more than today, a 55% difference. There were a lot more choices for buyers last year.

Luxury End: The luxury market is starting to improve. In the past two-weeks, demand for homes above $1.25 million increased by 17 pending sales, up 12%, and now totals 157. The luxury home inventory increased by 70 homes, up 5%, and now totals 1,571. Many luxury homeowners will continue to opt to wait to list their homes until after the economy opens back up, and demand will remain at lower levels as well. With the growth in demand outpacing the rise in the inventory, the overall Expected Market Time for homes priced above $1.25 million decreased from 322 to 300 days in the past couple of weeks.

Year over year, luxury demand is down by 235 pending sales, or 60%, and the active luxury listing inventory is down by 798 homes, or 34%. The Expected Market Time last year was at 181 days, much better than today.

For homes priced between $1.25 million and $1.5 million, in the past two-weeks, the Expected Market Time decreased from 205 to 192 days. For homes priced between $1.5 million and $2 million, the Expected Market Time decreased from 252 to 229 days. For homes priced between $2 million and $4 million, the Expected Market Time increased from 363 to 418 days. For homes priced above $4 million, the Expected Market Time decreased from 1,118 to 586 days. At 586 days, a seller would be looking at placing their home into escrow around December 2021.

Orange County Housing Market Summary:

1. The active listing inventory increased by 281 homes in the past two-weeks, up 6%, and now totals 4,625, its largest increase of the year. In the past four-weeks, 54% fewer homes were placed on the market compared to the prior 5-year average; thus, COVID-19 is suppressing the inventory. Last year, there were 7,185 homes on the market, 2,560 more than today, a 55% difference.

2. Demand, the number of pending sales over the prior month, increased by 92 pending sales in the past two-weeks, up 9%, and now totals 1,172, its first increase since the “stay at home” order was placed back in March. In the past 5-years, demand has increased an average of 0%. COVID-19 is continuing to suppress demand; yet, the bottom was reached a couple of weeks ago. Last year, there were 2,653 pending sales, 126% more than today.

3. The Expected Market Time for all of Orange County decreased from 121 days to 118, a Balanced Market (between 90 and 120 days). The drop was due to the rise in demand outpacing the rise in the supply. It was at 81 days last year, much better than today.

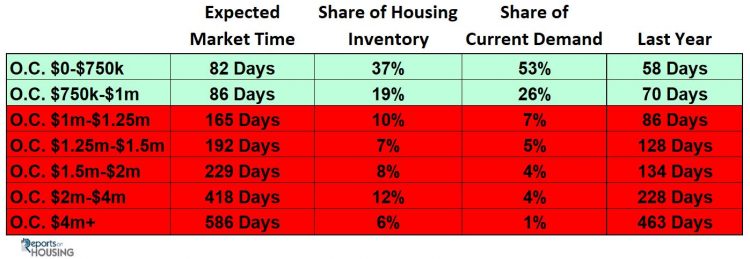
4. For homes priced below $750,000, the market is a slight Seller’s Market (between 60 and 90 days) with an expected market time of 82 days. This range represents 37% of the active inventory and 53% of demand.

5. For homes priced between $750,000 and $1 million, the expected market time is 86 days, a slight Seller’s Market. This range represents 19% of the active inventory and 26% of demand.

6. For homes priced between $1 million to $1.25 million, the expected market time is 165 days, a Buyer’s Market (greater than 150 days).

7. For luxury homes priced between $1.25 million and $1.5 million, in the past two weeks, the Expected Market Time decreased from 205 to 192 days. For homes priced between $1.5 million and $2 million, the Expected Market Time decreased from 252 to 229 days. For luxury homes priced between $2 million and $4 million, the Expected Market Time increased from 363 to 418 days. For luxury homes priced above $4 million, the Expected Market Time decreased from 1,118 to 586 days.

8. The luxury end, all homes above $1.25 million, accounts for 33% of the inventory and only 14% of demand.

9. Distressed homes, both short sales and foreclosures combined, made up only 1% of all listings and 1.6% of demand. There are only 18 foreclosure s and 26 short sales available to purchase today in all of Orange County, 44 total distressed homes on the active market, up3 from two-weeks ago. Last year there were 68 total distressed homes on the market, slightly more than today.

10. There were 2,383 closed residential resales in March, 5% more than March 2019’s 2,277 closed sales. March marked a 17% increase compared to February 2020. The sales to list price ratio was 98.4% for all of Orange County. Foreclosures accounted for just 0.4% of all closed sales, and short sales accounted for 0.5%. That means that 99.1% of all sales were good ol’ fashioned sellers with equity.

Make everyday the best day possible.

Contact me when the time is right,

Roy Hernandez
“Your Trusted Partner in Real Estate”
TNG Real Estate Consultants
Realtor@RoyalAgent.net
949.922.3947
BRE#01202958
Article courtesy of Steven Thomas, Quantitative Economics and Decision Sciences
 

Filed Under: Roy's Blog

OCounty Housing Report: Broad Market Interruption

April 21, 2020 By Roy Hernandez Leave a Comment

Like the rest of “daily life,” the housing market has not been spared from the sweeping effects of sheltering in place.
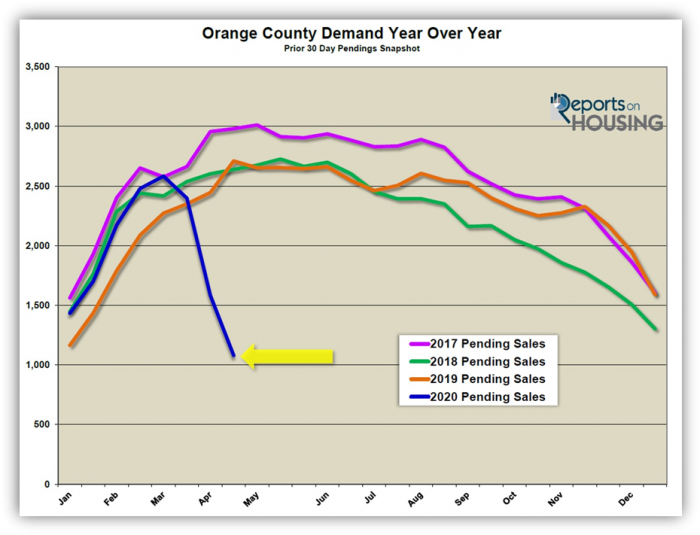
Supply and Demand: A low supply is confronted with low demand.
Life has changed. Public schools, private schools, day care, universities, date night, dine-in restaurants, sporting events, organized sports, concerts, movie theaters, trips to the mall, amusement parks, public pools, beaches, neighborhood parks, travel, and frozen yogurt have all been put on hold. The “stay at home” order has affected every aspect of daily life. The Orange County housing market is no different.

A man in Orange County tested positive for COVID-19 on January 25th, becoming the first confirmed case in California. On March 4th, Gov. Newsom declared a state of emergency for the Golden State. Disneyland closed its gates and most major sports leagues suspended their seasons on March 12th. Schools closed on March 13th. The “stay at home” order was announced by the governor on March 19th. That means that California citizens had been sheltering in place for four weeks as of April 16th.

Demand is defined as the past 30-days of pending sales activity. Up to this point, demand readings have included weeks prior to the order when the housing market was still hitting on all cylinders. The market was scorching hot at the very beginning of march despite the state of emergency that was declared. The market began to decelerate in the second week of March. By March 19th, with the kids already at home and preparing for online learning, housing demand slowed to a COVID-19 crawl. It was at inherent demand levels.

Now that it has been more than four weeks of virus suppressed demand, the Orange County demand readings are a true depiction of the number of pending sales that will take place under the “stay at home” circumstances. The current reading is an accurate indicator of the current market until the economy begins to reopen down the road. There is a broad housing market interruption due to the Coronavirus that has had a major impact on the velocity of the market, demand, and the supply of homes, the active inventory. Both have been impacted significantly. Yes, demand is at ultra-low, anemic levels, but so is the active listing inventory. Buyers are not writing that many offers, and fewer homeowners are pounding FOR SALE signs in their front yards.

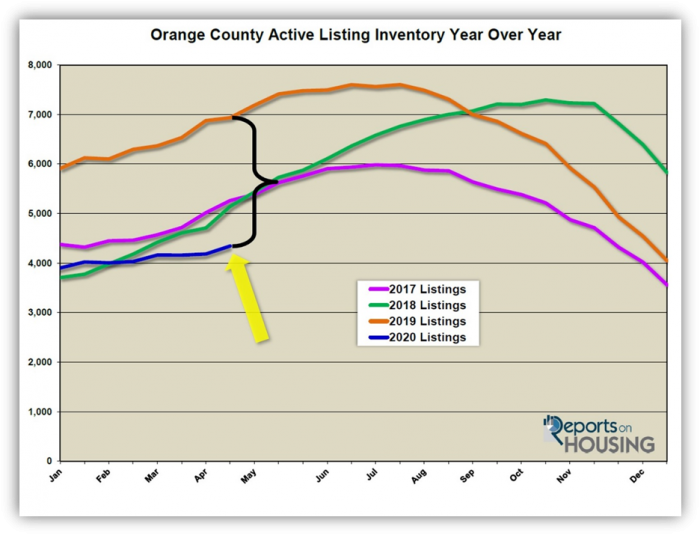
As a result of everyday life grinding to a halt, demand dropped by 55% in the past month, from 2,398 pending sales to 1,080. These demand levels were last seen in 2007. Since the “stay at home” order on March 19th, the number of homes placed on the market dropped by 52% compared to the prior 5-year average. That is 1,972 fewer homeowners entering the fray. Consequently, the active inventory has only grown by 185 homes in the past four weeks, a 4% rise, and the inventory now sits at 4,344 homes. While demand may be at Great Recession levels, the inventory is not growing like it did in 2006 through 2008 when it reached nearly 18,000 homes.

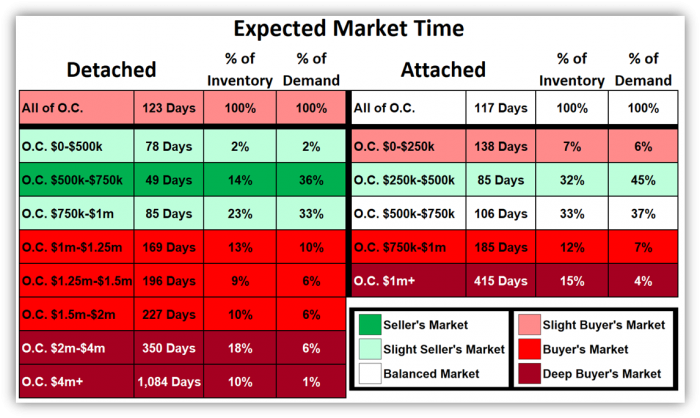
In looking at the county’s different price ranges and detached versus attached, the entire market has been impacted. Yet, there are a few ranges that are still functioning. They have evolved from an extremely hot price range to one that still favors sellers but a bit slower. For detached homes, everything below $1 million lines up at least slightly in the seller’s favor. Between $500,000 to $750,000, the “bread and butter” of the local housing market, detached homes are obtaining more offers than any other range and sellers get to call most of the shots. The Expected Market Time (the time between hammering in the FOR-SALE sign to opening escrow) for that range is at 49 days, a Seller’s Market. Four weeks ago, it was at 25 days. For detached above $1,000,000, the market slows considerably, leaning in favor of buyers. Above $2 million has nearly ground to a halt. For attached, only condominiums between $250,000 to $500,000 slightly favors sellers with an Expected Market Time of 85 days. It was at 34 days four weeks ago. The $500,000 to $750,000 price range for condominiums is balanced. All other condominium ranges, including those below $250,000, favor buyers. For attached above $1 million, the market is extremely slow.

WARNING TO BUYERS: There is very little price movement within the overall Orange County housing market; do not expect a deal. From the real estate trenches, some prospective buyers are expecting values to drop 10%, 20%, or even 30% like they did during the Great Recession. The current Expected Market Time for Orange County is 121 days, a slight Buyer’s Market, a market where buyers get to call more of the shots, but values are not changing much at all. During the Great Recession the Expected Market Time climbed to nearly 500-days for all of Orange County. Only at those levels will values drop substantially,

WARNING TO SELLERS: Until the shelter in place order is lifted expect meager buyer activity, showings, and offers. Even with real estate being reclassified as an essential service, it really has not moved the needle in terms of demand. Expect demand to remain at its current, inherent levels and the active inventory to continue to slightly grow, ultimately slowing the market further until the economy is unlocked.

Across the board, the broad housing market has been interrupted and the disruption will continue. Even when the governor opens economic activity, it will not be a light switch flipped to “on;” instead, it will be more like a dimmer. Demand will slowly thaw as more homeowners opt to place their homes on the market. It will be a slow, gradual evolution and there will not be a sudden spike in either supply or demand.

Active Inventory: The current active inventory increased by 4% homes in the past two-weeks.
The active listing inventory increased by 161 homes in the past two-weeks, up 4%, and now sits at 4,344. This is the lowest level for mid-April since 2013, when the inventory reached the most anemic level of the housing expansion. Quite simply, there are very few homes on the market right now. This is due primarily to homeowners opting to NOT come on the market right now, with 52% fewer new FOR SALE signs in the past four-weeks compared to the prior 5-year average. This will continue until the economy is opened for business.

Last year at this time, there were 6,933 homes on the market, 2,589 more than today, a 60% difference. There were a lot more choices for buyers last year.

Demand: In the past two-weeks demand continued to plunge.
Demand, the number of new pending sales over the prior month, decreased from 1,584 to 1,080, shedding 504 pending sales, down 32%. Demand reflects all new escrows within the past four weeks. The current level is the first accurate picture of COVID-19 suppressed demand. Prior snapshots have included weeks prior to sheltering in place, with higher demand readings. Current demand is a much more accurate depiction of the business that can take place in the current environment. It will no longer continue to “plunge” as it has for the prior month. It will flatten from here until the economic activity at large can resume. At that point, demand will begin to thaw and rise once again.

Last year, there were 1,644 more pending sales compared to today, 152% extra, more than double.

In the past two-weeks the Expected Market Time increased from 79 to 121 days, a SLIGHT Buyer’s Market (between 120 and 150 days), where buyers get to call more of the shots, but home values are not appreciating much at all. Expect the market to only slightly cool from here as the inventory slightly rises and demand remains flat. Last year the Expected Market Time was at 76 days, much better than today.

Luxury End: The luxury market is nearly grinding to a halt.
In the past two-weeks, demand for homes above $1.25 million decreased by 66 pending sales, down 32%, and now totals 140. The luxury home inventory increased by 29 homes, up 2%, and now totals 1,501. Many luxury homeowners will continue to opt to wait to list their homes until after the outbreak and demand will remain at these low levels. With a substantial drop in demand, the overall Expected Market Time for homes priced above $1.25 million increased from 214 to 322 days in the past couple of weeks.

Year over year, luxury demand is down by 284 pending sales, or 67%, and the active luxury listing inventory is down by 778 homes, or 34%. The Expected Market Time last year was at 161 days, much better than today.

For homes priced between $1.25 million and $1.5 million, in the past two-weeks, the Expected Market Time increased from 120 to 205 days. For homes priced between $1.5 million and $2 million, the Expected Market Time increased from 140 to 252 days. For homes priced between $2 million and $4 million, the Expected Market Time increased from 323 to 363 days. For homes priced above $4 million, the Expected Market Time increased from 903 to 1,118 days. At 1,118 days, a seller would be looking at placing their home into escrow around May 2023.

Orange County Housing Market Summary:

• The active listing inventory increased by 161 homes in the past two-weeks, up 4%, and now totals 4,344. In the past four-weeks, 52% fewer homes were placed on the market compared to the prior 5-year average. Last year, there were 6,933 homes on the market, 2,589 more than today, a 60% difference.

• Demand, the number of pending sales over the prior month, decreased by 504 pending sales in the past two-weeks, down 32%, and now totals 1,080. In the past 5-years, demand has increased an average of 4%. The drop is due to the Coronavirus. Last year, there were 2,724 pending sales, 152% more than today.

• The Expected Market Time for all of Orange County increased from 79 days to 121, a slight Seller’s Market (between 120 and 150 days). The increase is due to the Coronavirus. It was at 76 days last year, much better than today.

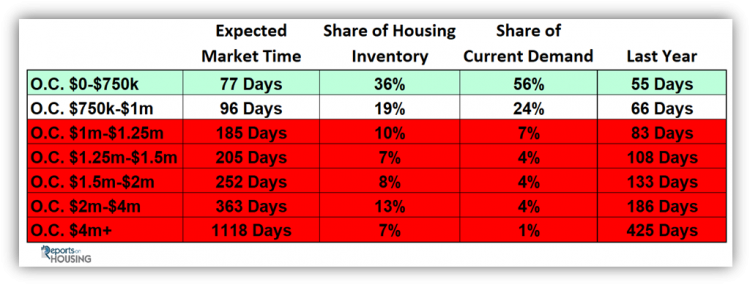
• For homes priced below $750,000, the market is a slight Seller’s Market (between 60 and 90 days) with an expected market time of 77 days. This range represents 36% of the active inventory and 56% of demand.

• For homes priced between $750,000 and $1 million, the expected market time is 96 days, a Balanced Market (between 90 and 120 days). This range represents 19% of the active inventory and 24% of demand.

• For homes priced between $1 million to $1.25 million, the expected market time is 185 days, a Buyer’s Market (greater than 150 days).

• For luxury homes priced between $1.25 million and $1.5 million, in the past two weeks, the Expected Market Time increased from 120 to 205 days. For homes priced between $1.5 million and $2 million, the Expected Market Time increased from 140 to 252 days. For luxury homes priced between $2 million and $4 million, the Expected Market Time increased from 323 to 363 days. For luxury homes priced above $4 million, the Expected Market Time increased from 903 to 1,118 days.

• The luxury end, all homes above $1.25 million, accounts for 35% of the inventory and only 13% of demand.

• Distressed homes, both short sales and foreclosures combined, made up only 0.9% of all listings and 1.7% of demand. There are only 18 foreclosure s and 23 short sales available to purchase today in all of Orange County, 41 total distressed homes on the active market, down 4 from two-weeks ago. Last year there were 59 total distressed homes on the market, slightly more than today.

• There were 2,383 closed residential resales in March, 5% more than March 2019’s 2,277 closed sales. March marked a 17% increase compared to February 2020. The sales to list price ratio was 98.4% for all of Orange County. Foreclosures accounted for just 0.4% of all closed sales, and short sales accounted for 0.5%. That means that 99.1% of all sales were good ol’ fashioned sellers with equity.

Filed Under: Roy's Blog

How will the coronavirus impact home prices?

April 6, 2020 By Roy Hernandez

Like with most businesses today, the coronavirus has adversely affected the real estate industry. However, I will continue to share information related COVID-19 and its impact on real estate. Contact me for questions about renting, buying, and selling in today’s RE market.

How will the coronavirus impact home prices?

C.A.R. is still forecasting a modest increase in the median home price for 2020, but the current outlook for home prices is difficult to assess in this rapidly changing environment. On one hand, lower mortgage rates will make homebuying more attractive — particularly for first-time homebuyers and for lower-priced homes generally, as those home typically rely on debt financing in much larger proportions that investment properties, second homes and luxury properties.

At the same time, there have been significant negative wealth effects in the wake of market fluctuations. This will reduce demand from homebuyers who were relying on financial market wealth as a source of funds for luxury homes, second homes and investment properties. There might also be counter-vailing effects as some investors seek refuge from turbulent financial markets in real estate.

The net effect of these various forces remains to be seen. Currently, C.A.R. expects negative economic growth during the second quarter of 2020 (and possibly the first), and C.A.R. has modeled scenarios where the negative effects on consumer confidence outweigh the positive effects of lower interest rates such that home prices shrink back from their current highs. Such a scenario is contingent upon the coronavirus deteriorating beyond what is currently envisioned with the infection progressing into the summer with peak cases not being reached until the third quarter.

Roy Hernandez 
“Your Trusted Partner in Real Estate”
TNG Real Estate Consultants
Realtor@RoyalAgent.net
949.922.3947
BRE#01202958

Filed Under: Roy's Blog

  • 1
  • 2
  • 3
  • …
  • 18
  • Next Page »

RoyaltyAgent@gmail.com

Search All Houses FOR SALE

Hot Bank Foreclosures & REO

Current Mortgage Rates

[mlrates state="CA" size="narrow"]

Fullerton Homes FOR SALE by Price

$300,000- $500,000
$500,000- $700,000
$700,000- $900,000
$900,000- $1,100,000
$1,100,000 and above

Fullerton Condos FOR SALE by Price

$200,000- $300,000
$300,00- $400,000
$400,000 and above

Our Coverage Areas

Brea Homes FOR SALE

Brea North Hills FOR SALE

Whittier Homes FOR SALE

Fullerton Homes FOR SALE

Placentia Homes FOR SALE

La Habra Homes FOR SALE

Yorba Linda Homes FOR SALE

Anaheim Homes FOR SALE

Brea Special Events

Community Reports

downtown brea

City Information


Brea

Yorba Linda

Placentia

Fullerton

La Habra

Tag Cloud

Anaheim Hills real estate for sale Anaheim house for sale bank owned Brea bank owned for sale Brea community info Brea foreclosure for sale Brea house for sale Brea houses for sale Brea real estate Brea real estate for sale Brea REO Brea REO for sale buyer real estate news foreclosure for sale Fullerton house FOR SALE Fullerton houses for sale Fullerton real estate Fullerton Real Estate For Sale fullerton resort living housing data housing market housing news la habra houses for sale La Habra real estate for sale north orange county for sale north orange county real estate orange county housing info orange county real estate Orange county real estate for sale orange county shadow inventory placentia condos for sale placentia for sale placentia homes for sale placentia houses for sale placentia real estate real estate information real estate news orange county REO for sale REO property for sale seller information whittier houses for sale Yorba Linda for sale Yorba Linda homes for sale yorba linda houses for sale Yorba Linda real estate for sale
The Virtual Realty Group
Roy Hernandez
cell/text (949) 922-3947
RoyaltyAgent @ gmail.com
RoyalAgent.net
BRE#01202958
  • Blog Page
  • I’d like to sell my house
  • About

Copyright © 2025 Website by The Burrell Group · Log in