• Home
  • Buyers
    • Buyer’s Guide
    • For Buyers
    • Buyer Wish List
  • Sellers
    • Seller’s Guide
    • For Sellers
    • Property Updates
    • Marketing & Listing Proposal 2019
    • Prepare your house For Sale
    • How much is my house worth today?
  • City Info
    • Search All Towns USA
    • Community Reports
    • Anaheim
    • Brea
    • Orange
    • Fullerton
    • La Habra
    • Placentia
    • Santa Ana
    • Yorba Linda
  • News
  • Schools
  • Contact Us

Roy Hernandez Real Estate Services

Orange county real estate houses for sale

You are here: Home / Archives for Roy Hernandez

OC Housing Report: Right NOW!

November 24, 2015 By Roy Hernandez Leave a Comment

nowThe window of opportunity to take advantage of today’s historically low
interest rates is starting to close.

Interest Rates: after a couple of years of hinting at an eventual hike in rates, the Federal Reserve appears ready to make a move and raise the short term rate for the first time in nine years.
The Federal Reserve has been talking about raising the short term rate for a couple of years now. They kept kicking the proverbial can further down the road. It was supposed to be at the end of last year, then it was going to be the Spring of 2015, then in the Autumn, but they never pulled the trigger.

They have fooled just about everybody, from experts to the average person on the street. They seem to be talking out of both sides of their mouths. By mid-September of this year, the entire world had already factored in an increase in the short term rate. Instead, the Federal Reserve pointed out instability in China and other global markets and decided to maintain the status quo. The U.S. and world stock markets were already volatile and they responded negatively, dropping like a rock.

The following week, Janet Yellen, the Chair of the Federal Reserve, delivered a speech at the University of Massachusetts, and, out of character for the Fed, stated something of profound substance. She said that they were going to raise the rate by the end of the year as long as there weren’t any major changes to the economic landscape. The U.S. and world stock markets soared after her speech.

The reason the world sees a rise in our rates as something good is because it indicates that the Federal Reserve has faith in the U.S. economy. Their lack of action, especially in September, proved to be too much for the worldwide psyche. “Do they know something we don’t know?” They used to change the rate every other month and sometimes in between. It would go up, down, up, up, down, up, down, etcetera. It felt as if somebody was behind the wheel of the U.S. economic bus.

They did not pull the trigger in mid-October, but all indicators are “go” for mid-December. They are looking at a quarter of a percent hike in the short term rate. They are moving off of zero for the first time in seven years and getting back behind the wheel of the U.S. economic bus. The changes in the short term rate will not be as swift as prior Federal Reserve movements in the past, but nonetheless, they are moving in a positive direction. The short term rate effects savings

mortgage payment change

accounts, CD’s, commercial loans, and the rate at which banks borrow money from the Federal Bank window. As banks are charged more, long term rates, mortgages for homes, eventually go up as well.
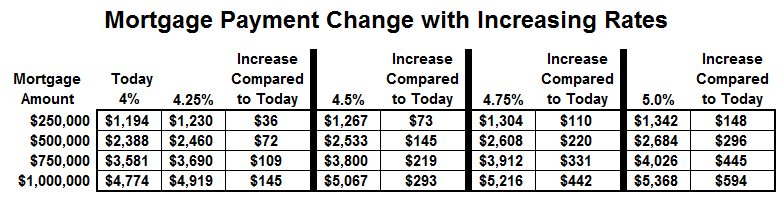
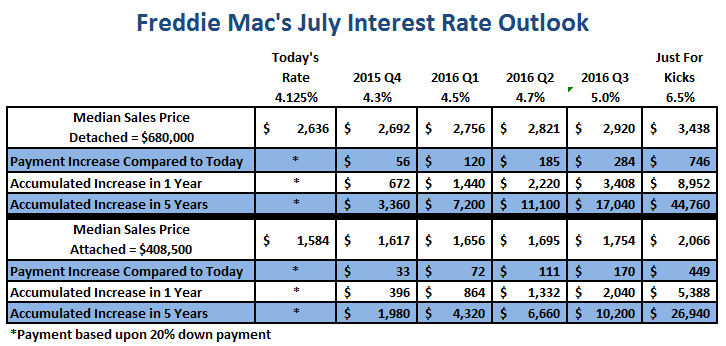
An increase of a quarter of a point does not drastically change the monthly mortgage payment. But, as interest rates continue to climb, it certainly will put a dent in a borrower’s wallet. Remember, this is a monthly payment. So, for a $750,000 mortgage payment, the payment increases $109 per month every single month when the interest rate rises by just a quarter of a point. That’s an extra $1,308 per year. And, if the Fed continues to increase rates, we could find rates rising to 4.75% by the end of 2016. If that happens, the monthly mortgage payment for a $750,000 mortgage climbs by an extra $331 per month compared to today, or nearly $4,000 a year. That’s a lot of money. For a $500,000 mortgage at 4.75%, the monthly payment increases by $220 per month compared to today, or $2,640 per year. That’s a lot of money for the middle class family.

Keep in mind, historically speaking, 4.75% and 5% are not bad rates. We have just become accustom to ridiculously low rates complements of the Federal Reserve stimulating the U.S. economic engine for nearly a decade. The long term average for interest rates since 1972 is 8.5% and since 1990 it’s 6.6%. Eventually, down the road, interest rates will hit 5% and beyond, most likely topping at around 5.25%. For the $500,000 middle class borrower, a 5% interest rates means an extra $296 per month more compared to today. That’s $3,552 extra every single year, equivalent to a nice Hawaiian vacation every year for the term of the loan if a buyer acts NOW.

That’s right, NOW is the time to take advantage of today’s rock bottom rates. They might not be as low as they were earlier in the year, but the gift from the Federal Reserve is coming to an end.

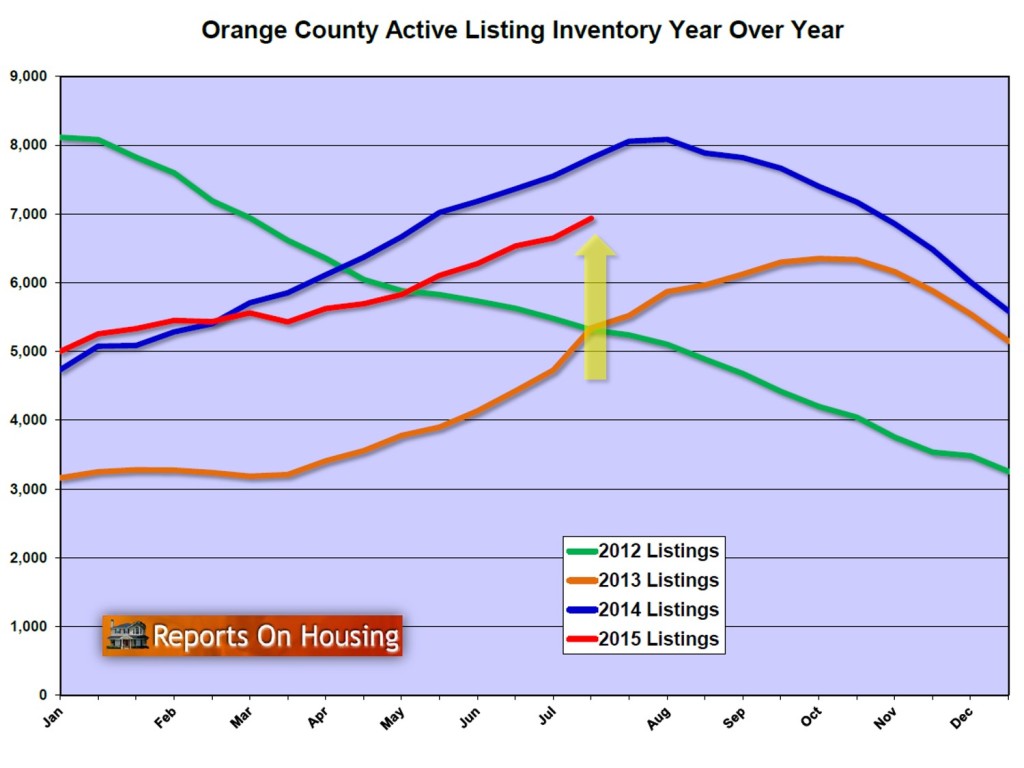
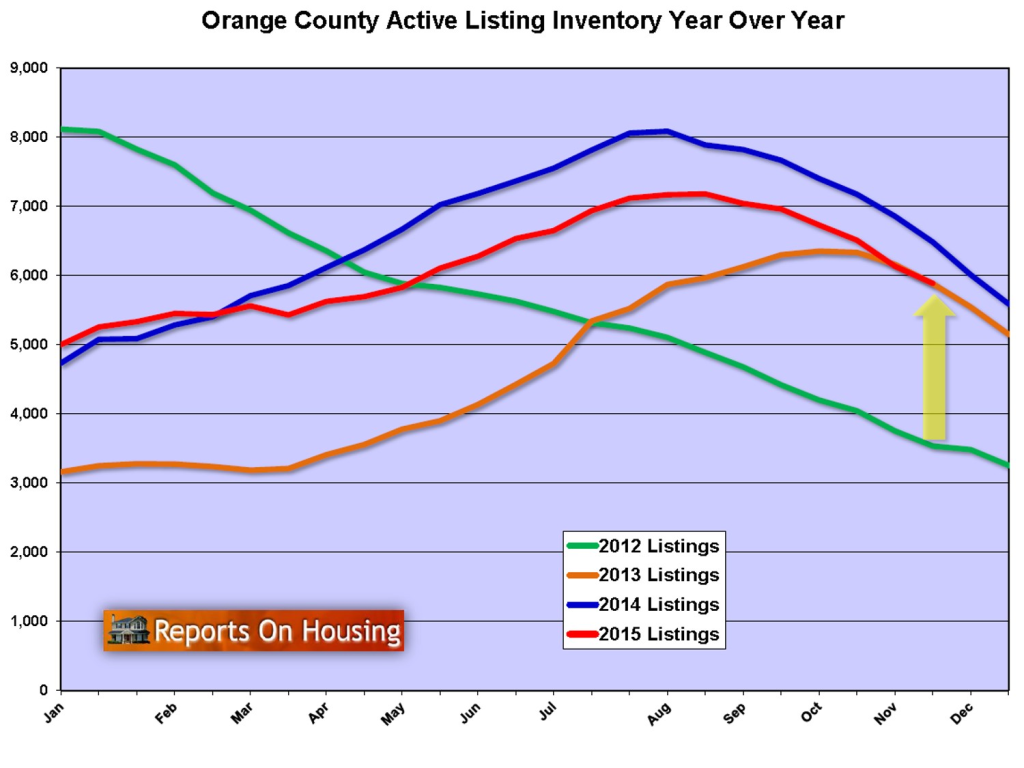
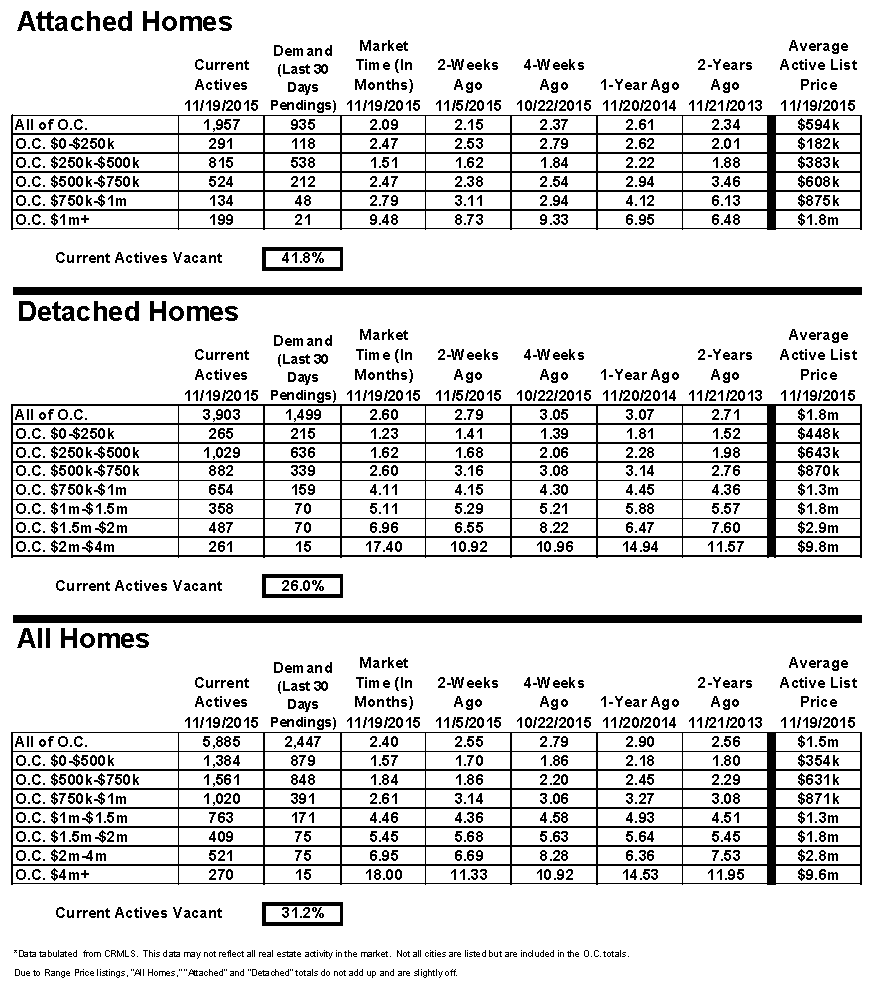
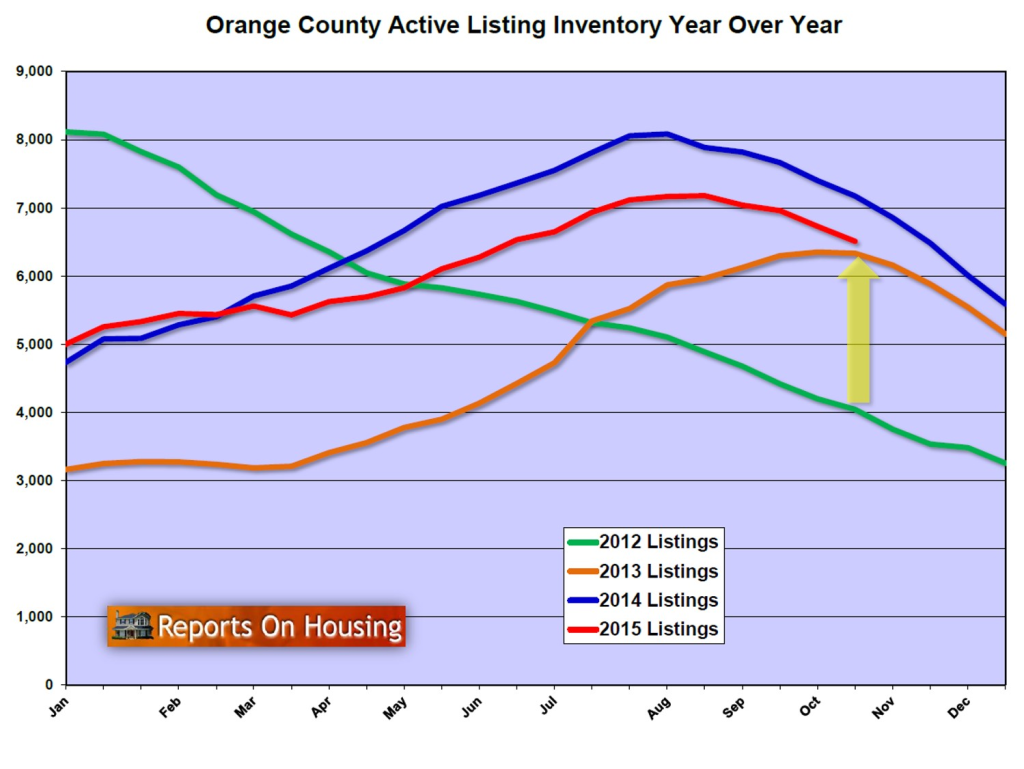
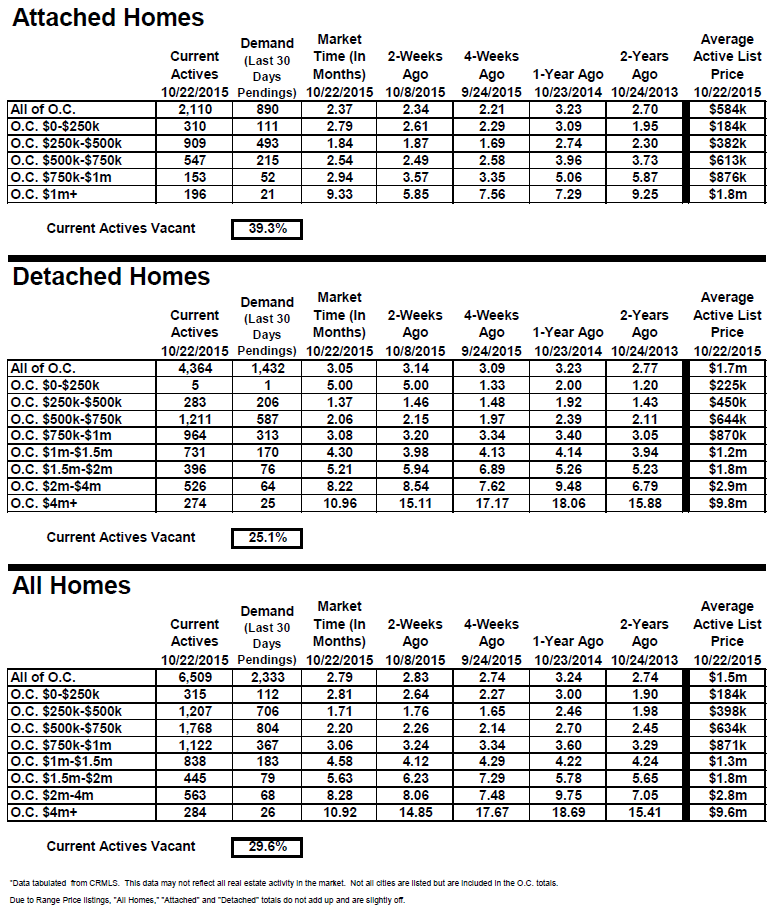
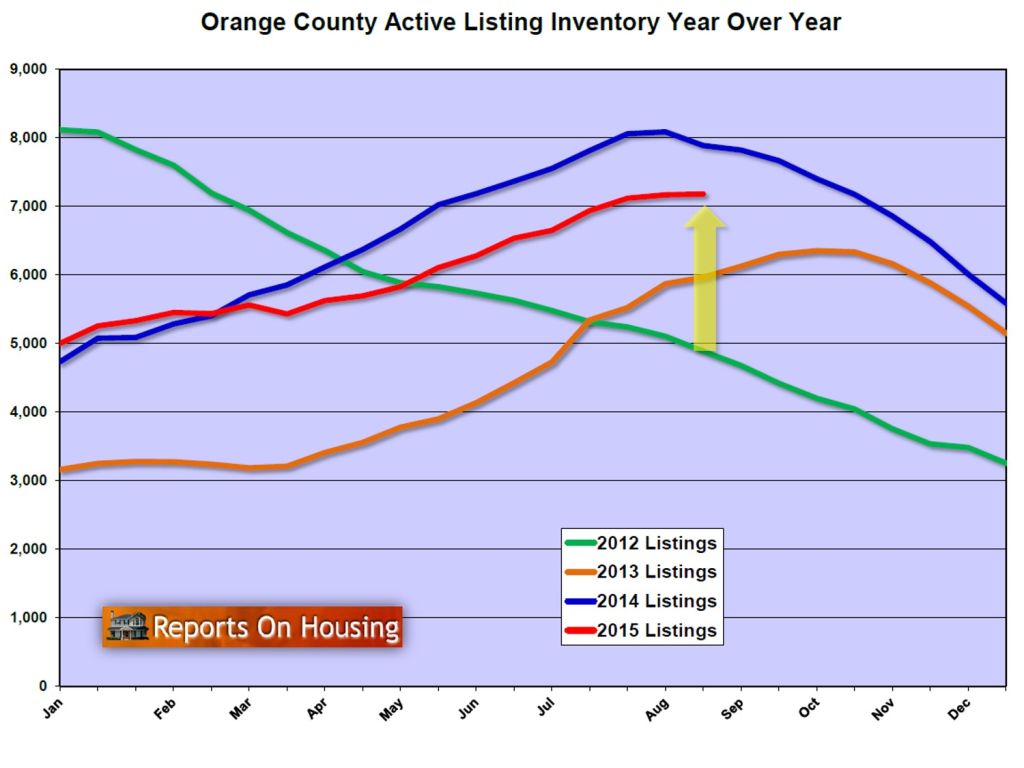
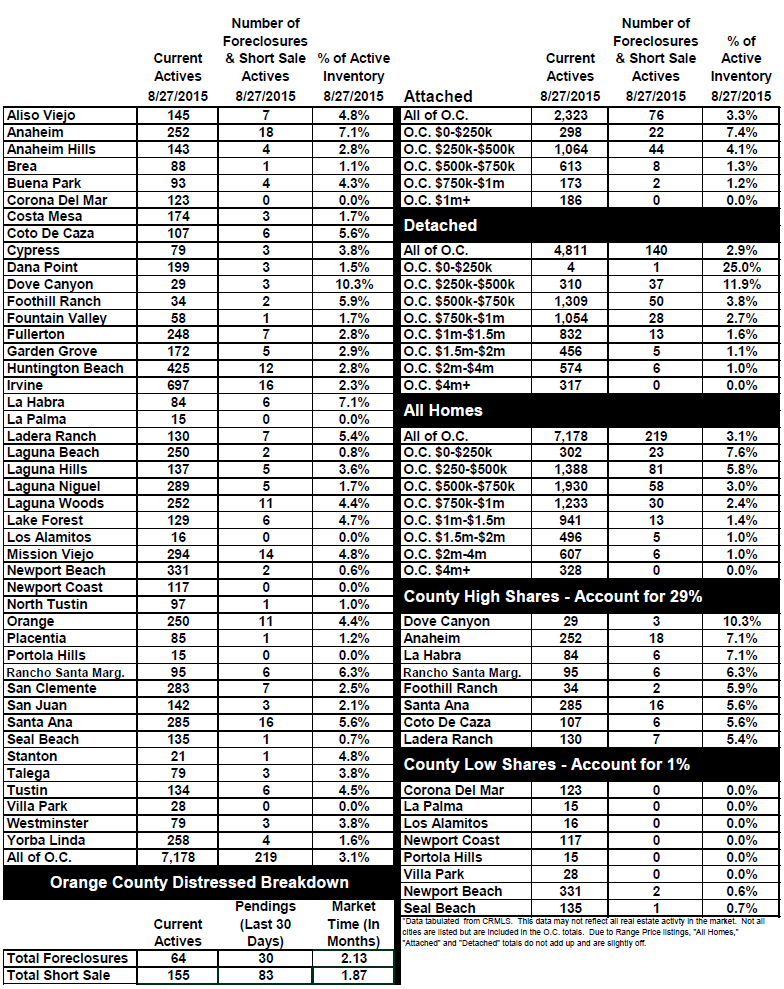
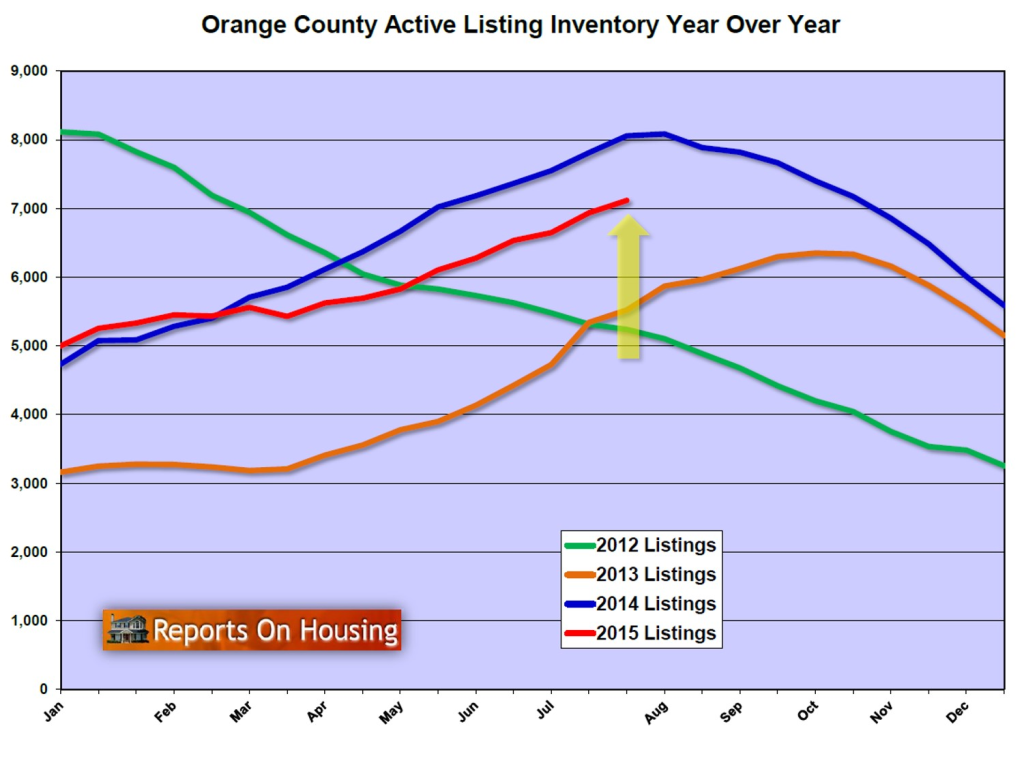
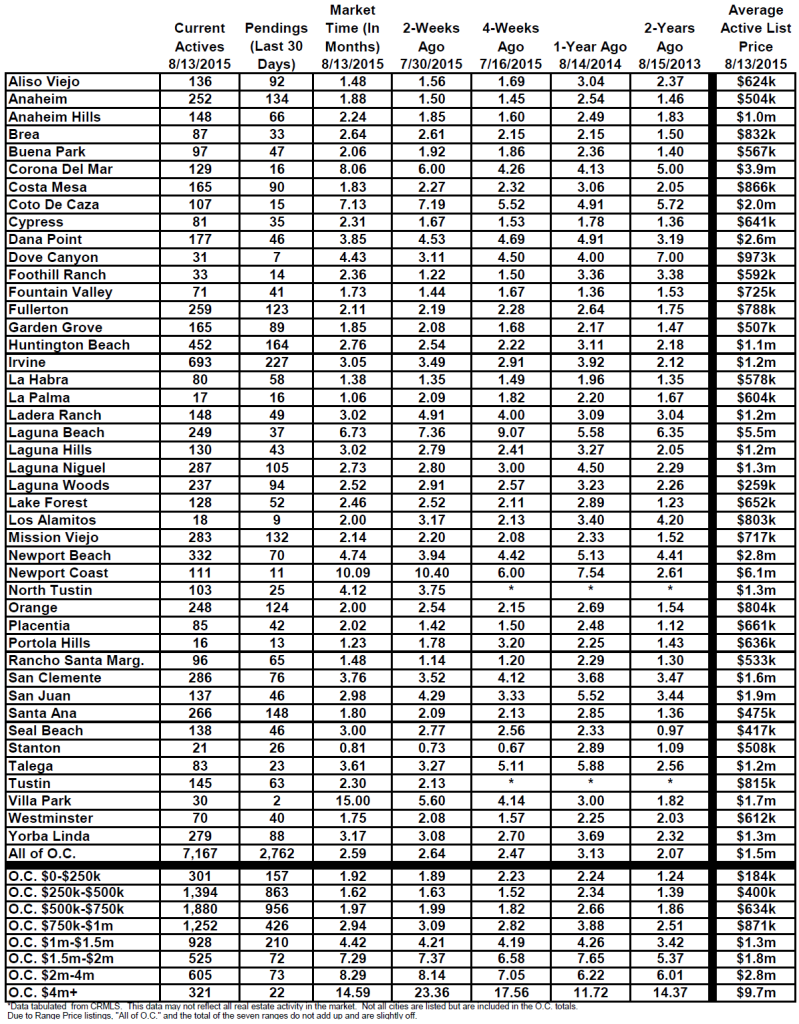
Active Inventory: the inventory dropped by 10% in the past month.
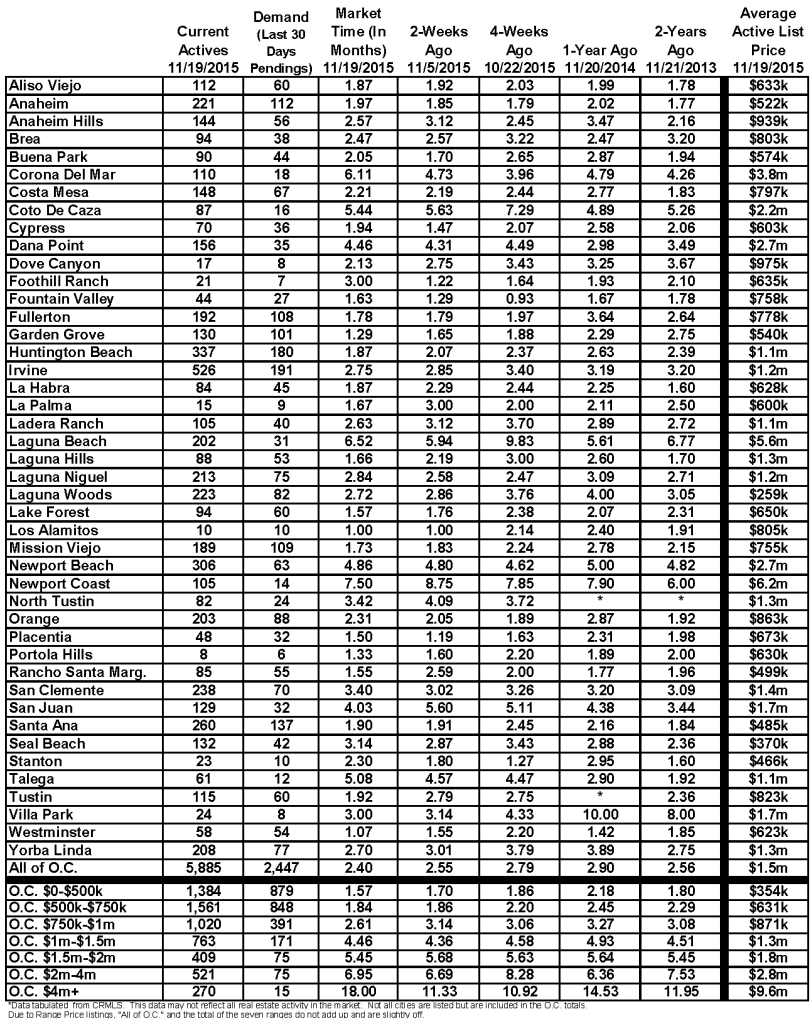
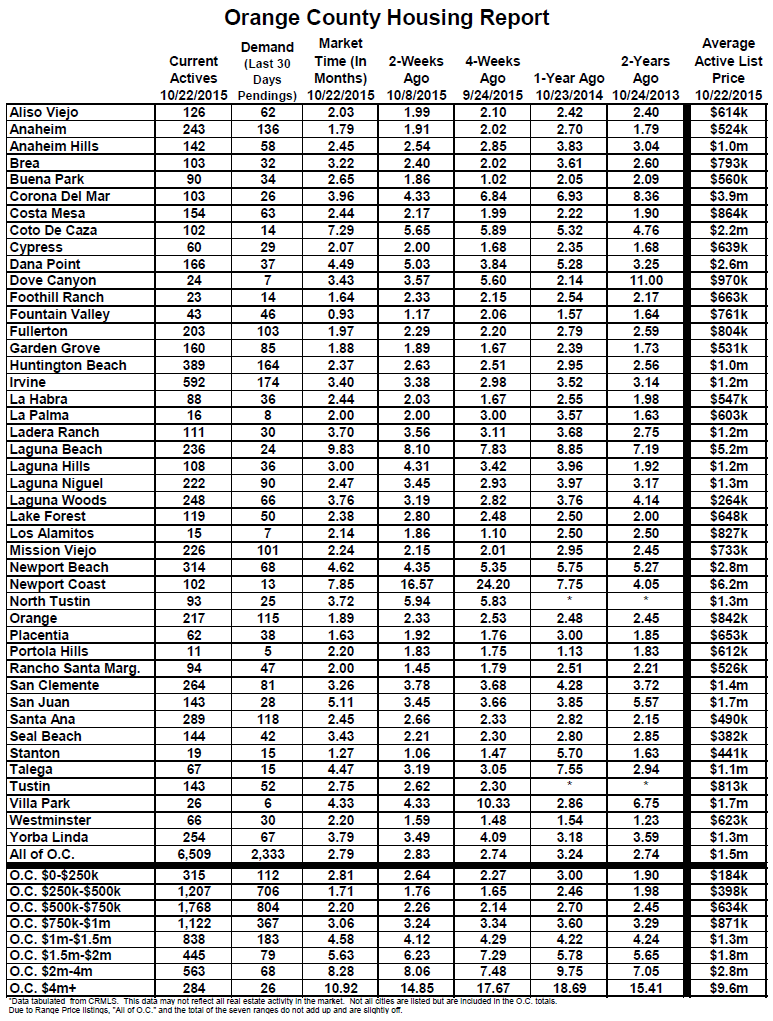
In the past month, the active inventory dropped by 624 homes, or 10%, and now sits at 5,885. The Holiday Market has officially begun with Thanksgiving just a few days away. This is the slowest season for Orange County real estate. It’s when both supply, the active inventory, and demand, new escrows, drop to their lowest point of the year. The active inventory will continue to fall like a rock and will reach its lowest point of the year on December 31st. The season continues through Super Bowl Sunday, when Orange County begins its transition into the Spring Market.

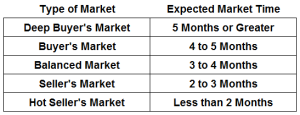
Last year at this time the inventory totaled 6,484 homes, 599 more than today, with an expected market time of 2.9 months, or 87 days, nearly a balanced market that does not favor a buyer or seller. In comparison, today’s expected market time is 72 days, a slight seller’s market. A slight seller’s market means that there is not much price appreciation, but sellers are able to call more of the shots.

oc active listing inventory

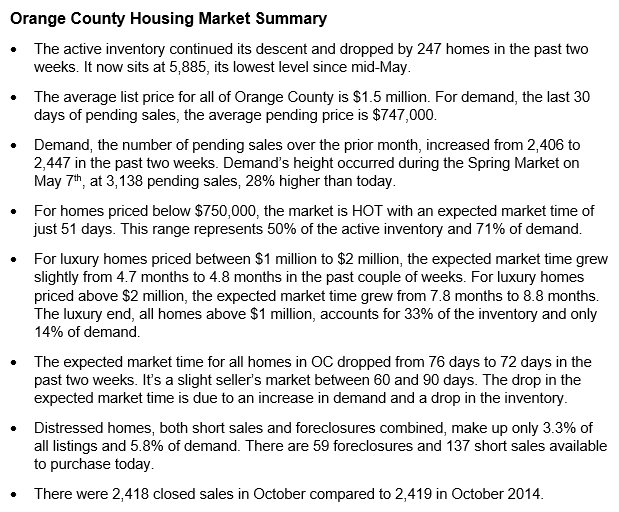
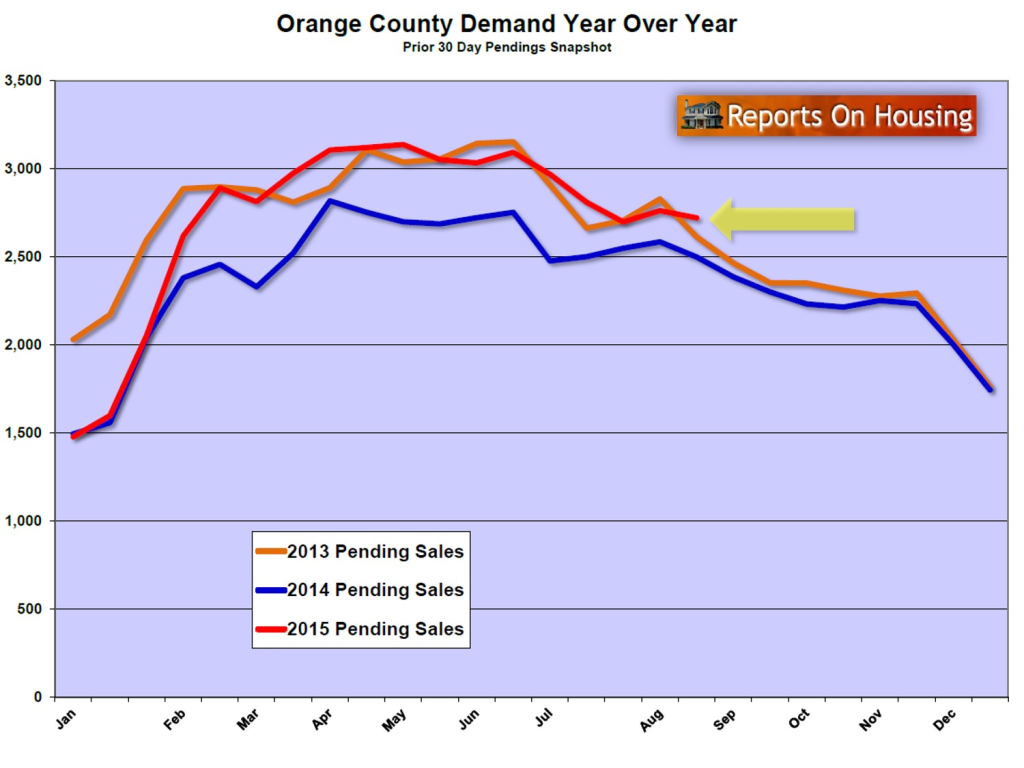
Demand: Demand increased by 5% in the past month.
Demand, the number of new pending sales over the prior month, increased by 114 homes in the past month and now totals 2,447 pending homes. This bump in demand is typical for this time of the year as buyers are poised to take advantage of closing just prior to the New Year, an okay time to move a family while the kids are on Winter Break.

Now that we have entered the Holiday Market, demand will drop to its lowest level of the year by year’s end. It will start to rise at the start of 2016, but will not start its Spring Market surge until after Super Bowl weekend.

Last year at this time there were 213 fewer pending sales, 10% less, totaling 2,234.

Summary:

summary

Have a great week and have a terrific Thanksgiving!

Roy Hernandez

activity by city

attached detached stats

[gravityform id=”13″ title=”true” description=”true”]

Filed Under: Roy's Blog

OC Housing Report: Home Values Online… SCARY!

November 15, 2015 By Roy Hernandez Leave a Comment

eye openerToday’s sellers and buyers turn to the Internet to determine their
home’s value but forget to look at the fine print.


Online Home Valuation Tools: even though sellers and buyers turn to Internet sites to establish the property value of a home, it’s not even close to being accurate.
Everything is on the Internet. Recipes, comparison shopping, product ratings, music, dating, news, financial tips, economic analysis, entertainment, medical information, every business and every person is now on the Internet. With access to so much information, sellers and buyers now feel empowered with the ability to go online to learn as much about the home selling and home buying process as they wish. They can search to their hearts content as everything is now seemingly at their fingertips.

With this access comes the sense that sellers and buyers can control the process. They feel like they are in the driver’s seat. From home searches, to researching about the skillset of a REALTOR®, to looking at payment calculators, they can do a tremendous amount of research from the comfort of their homes. Zillow.com, REALTOR.com, Trulia.com, OCRegister.com, LATimes.com, YahooRealEstate.com, CNN.com, CNBC.com, etcetera, there are plenty of choices to learn more about the local, regional, and national real estate markets. There is a lot of great information available to real estate consumers to help in the process. Unfortunately, there is plenty of misinformation too.

The number one real estate website is Zillow.com. The main purpose of the site is to determine a home’s value, what they more affectionately refer to as a Zestimate®. Tragically, sellers and buyers rely on this site in their attempt to secure the precise value of a home. In looking up the Zestimate® of a home, sellers and buyers feel as if they are tapping into the most complex, accurate real estate program known to man. They enter in an address and Zillow® spits out the exact market value of a home. The problem is that it is NOT accurate at all. The site admits to its own shortcomings on the landing page and states, “Use the Zestimate® as a starting point in determining your current and future home value.” Not too many buyers are going to take the time to read that admission.

Good luck on finding the fine print too. You have to click on the term “Zestimate®,” even though it does not have a hyperlink, to learn more about what goes into their estimate. The fine print can be found by then clicking on “How Accurate is the Zestimate®?” Isolating Orange County is an even further challenge. The numbers illustrate exactly why sellers and buyers cannot rely on this tool to accurately hone in on a home’s value. It also illustrates why they should not even rely on the site as a “starting point” in the home valuation process.RE stats

Their numbers are eye opening. Shocking is an even better description when anybody with an economic background takes a closer look. Zestimate® accuracy is computed by comparing the actual final sales price of a home to the Zestimate® that the system originally came up with. In Orange County, only 41% of all closed sales were within 5% of the actual sales price. That means that 59% were off by more than 5%. For proper perspective, let’s take a look at a $700,000 Zestimate®. 5% of $700,000 is $35,000. It could be off by $35,000 more OR $35,000 less. That means that the actual value would be somewhere between $665,000 and $735,000, a $70,000 gap. That is just way too big of a spread to be able to pinpoint the value of a home.

67% of all closed sales were within 10% of the Zestimate®, meaning that 33%, one-third, is off by more than 10%. For the $700,000 Zestimate® example, the actual sales price would be somewhere between $630,000 and $770,000, a $140,000 gap. And, 86% of all closed sales were within 20% of the Zestimate®, meaning that 14% were off by more than 20%. That basically means that 1.4 out of 10 homes is off by a truckload. For the $700,000 Zestimate® example, the actual sales price would be somewhere between $560,000 and $840,000, a $280,000 gap.

To rely on Zillow® to determine the value of a home is nothing short of absurd. Sellers and buyers typically only bring up the Zestimate® when it works in their favor, about a 50/50 chance of that happening. If a home that should really sell for $650,000 has a Zestimate® at $700,000, the seller stubbornly ends up overpricing their home and is forced to reduce in order to find success. As a result of so many sellers feeling empowered to price based upon an online valuation tool, the housing market is plagued with overpriced homes.

There are thousands of valuation tools and some claim to be even more accurate than Zillow®, but that claim doesn’t really say much. Instead, buyers and sellers need to know the fine print which illustrates that while the Internet may be chalk fool of great real estate information, it just cannot be used to determine a home’s value. There are just too many factors that go into the price of each and every home. Every home is unique, making the valuation process too complex for even the most sophisticated computer program.

So, if you cannot use an online program to determine a home’s value, what is the best method in coming up with the Fair Market Value? Sellers and buyers need to turn to their REALTOR® to isolate the value, the true professional. They are able to help factor the condition, location, upgrades, and amenities of a home, something a computer program cannot duplicate.

Active Inventory: the inventory continued its descent, and shed another 3% in the past two weeks.
The Autumn Market inventory drop continued in the past couple of weeks, shedding 220 homes in the past two weeks and 450 over the past month. It now totals 6,509. This is the time of the year when not as many sellers are coming on the market and many unsuccessful sellers are throwing in the towel as we quickly approach the Holiday Market, now just a few weeks away. The inventory will continue its descent through the end of the year.

Last year at this time the inventory totaled 7,174 homes, 665 more than today, with an expected market time of 3.24 months, or 97 days. That’s 13 days longer than today.housing inventory YOY

Demand: Demand decreased by 2% in the past couple of weeks and 8% in the past month.
Demand, the number of new pending sales over the prior month, decreased by 45 homes in the past two weeks and now totals 2,333 homes. The drop is its lowest since the end of August. Demand stays fairly steady for the next month until it drops further as we dive into the Holiday Market. By the end of the year, it will drop to its lowest level, levels not seen since January.

Last year at this time there were 118 fewer pending sales, 5% less, totaling 2,215.

Distressed Breakdown: The distressed inventory increased by 23 homes in the past couple of weeks.
The distressed inventory, foreclosures and short sales combined, increased by 12%, or 23 homes, and now totals 208. Distressed homes are quickly reaching pre-Great Recession levels, a normal market.

In the past two weeks, the foreclosure inventory increased by 12 homes and now totals 62, Only 1% of the total active inventory is a foreclosure. The expected market time for foreclosures is 49 days. The short sale inventory increased by 11 homes in the past two weeks and now totals 146. The expected market time is 52 days. Short sales represent just 2% of the total active inventory.

Have a great week.

inventory stats

RE stats2

RE stats3

RE stats4

Filed Under: Roy's Blog

OC Housing Report: Price Correction? Keep Dreaming!

September 28, 2015 By Roy Hernandez Leave a Comment

keepdreaming

It seem that every year after we jump into the slower Autumn Market, buyers start talking about a housing price correction.

A Price Correction: Because the median price is within 6% of the record established in June of 2007, many buyers feel a correction is near. As soon as the kids go back to school the housing market shifts gears and we enter a new season, the Autumn Market. The inventory slowly drifts downward as fewer homes come on the market and many sellers throw in the towel; the best time of the year to sell a home is in the rearview mirror. Demand downshifts and slows as well. Buyers are no longer lunging over each other and getting caught up in bidding wars in order to purchase a home.

Buyers often mistaken this slower season as the beginning of a major market slowdown, one that will ultimately lead to a price correction. As we inch closer and closer to the Orange County median sales price record established last decade, their simple logic prevails. The last time prices were this high it lead to a major housing price correction. Logically, prices are about to drop again, right? Not necessarily.

The prior median sales price record was established in June 2007 at $645,000. The median sales price last month was at $610,000. During the Great Recession, the median low hit $370,000 in January 2009. So, August’s level is 65% above the recession low and just 5.4% away from matching Orange County’s record height. Buyers from the trenches are squawking that prices are just too high, so they feel that prices must be on the verge of dropping. Don’t bet on it.

The prior height was established 8 years ago. Even though inflation has been extremely mild, the Consumer Price Index in Orange County has been positive for years. Taking into consideration the slower, mild growth in overall prices, Orange County is closer to 15% off the prior peak, not 5%. Buyers are mistakenly comparing today’s prices to 2007, that’s 8 years ago, a long time ago.

Current data and trends simply do not support a housing correction anytime soon. Yes, we have cooled considerable from the red hot Spring Market. Back in April, the expected market time for homes on the market was a low 1.8 months, or 54 days. Today’s expected market time has increased to 2.7 months, or 82 days. Even with the increase, it is nowhere near a market that favor’s buyers. Last year at this time, Orange County was enjoying a balanced market, 3.33 months, or 100 days, one that did not favor buyers or sellers. A market is balanced when it sits between three and four months of inventory. Even though Orange County is now approaching balance, it is still a slight seller’s market, one where sellers can call more of the shots when it comes to the terms of a contract, but appreciation slows considerably. Home prices only appreciate rapidly when the expected market time drops to one-and-a-half months or less.

typeofmarket

Orange County has not experienced a buyer’s market since the beginning of 2011. Back then there were over 10,000 homes on the market and demand was similar to today. The supply of homes was much greater than today. When too many homes are left on the market, there is a lot more competition between sellers. When supply is high and demand is low, the biggest differentiator for a seller to make their home stand out among the competition is price. The more attractive the price, the quicker a home sells. That’s when prices drop. Back in 2007, the active inventory reached 17,898 homes and prices were falling like a rock.

Today there are 6,959 homes on the market, 30% fewer than the 10,000 home level back in 2011. The long term average for the active listing inventory is actually 8,500 homes. The current inventory trend is to drop through the end of the year. Even with an anticipated drop in demand as we approach the end of the year and eventually move into the Holiday Market, the drop in demand will be offset by a simultaneous drop in the inventory. The expected market time is projected to remain relatively flat through the end of 2015. Do not expect any major change in Orange County real estate market trends anytime soon.

For 2016, the Federal Reserve is posturing to slowly and methodically increase the short term rate, which ultimately affects mortgage rates. Since their moves will be deliberately slower, buyers will continue to flood the market to cash in on today’s historically low rates. Next year promises to be very similar to 2015 with increased demand and an inventory well below the long term average. It will once again be a sellers’ market.

The bottom line: in Orange County, do not expect a correction in home values anytime soon.

Active Inventory:  as is normal for the Autumn Market, the inventory continued to drop.

After peaking a month ago, the active inventory shed an additional 81 homes, or 1%, in the past couple of weeks, now sitting at 6,959. It was only above the 7,000 home mark for two months this year compared to five-and-a-half months in 2014. As we progress deeper into autumn, the days get shorter and the number of homes that come on the market drops as well. Just around the corner are the holidays, the biggest drops in the inventory each year. The inventory typically reaches a new bottom at the turning of the New Year. From there it will begin to rise.

Last year at this time the inventory totaled 7,663 homes, 704 more than today, with an expected market time of 3.33 months, or 100 days. That’s 18 additional days compared to today.

ocdemandYOY

Demand:  Demand decreased by 4% in the past couple of weeks.

Demand, the number of new pending sales over the prior month, decreased by 108 homes in just two weeks and now totals 2,537 homes. Demand was last at this level back in January of this year. Just as there are fewer sellers coming on the market, there are also fewer buyers looking to buy right now.

Last year at this time there were 236 fewer pending sales, totaling 2,301.

Distressed Breakdown: The distressed inventory decreased by 12 home in the past couple of weeks.

The distressed inventory, foreclosures and short sales combined, decreased by 12 homes in the past two weeks, a 5% drop, and now totals 220. The up and down swings of the distressed inventory has continued for a few months now. Even with these fluctuations, there really are not that many distressed homes hitting the market. With only 2.5% of all mortgage homes in Orange County currently upside down, there are far fewer homeowners in a precarious position compared to the days of the Great Recession when 25% of all mortgaged homes were upside down.

In the past two weeks, the foreclosure inventory decreased by 8 homes and now totals 65. Less than 1% of the total active inventory is a foreclosure. The expected market time for foreclosures is 61 days. The short sale inventory decreased by 4 homes in the past two weeks and now totals 155. The expected market time is 48 days. Short sales represent just 2% of the total active inventory.

Have a great week.

pic1inventory

pic2inventory

pic3inventory

pic4inventory


[gravityform id=”13″ title=”true” description=”true”]

Filed Under: Roy's Blog

OC Housing Report: FALL BACK… Like Usual

September 8, 2015 By Roy Hernandez Leave a Comment

autumnclockWe have officially transitioned into the Autumn Market, leaving both the Spring and Summer Markets in the rearview mirror.

The Autumn Market: the Orange County housing market just downshifted into a lower gear, part of a normal housing cycle.

The initial school bell just rang and families are getting back into their daily ritual of making lunches, participating in carpools, and getting up at the crack of dawn. That initial bell also indicated the start of housing’s Autumn Market. Buyers and sellers can expect a lot of changes. The key to success is having the right expectations.

First, expect the active listing inventory to drop from today’s level as fewer and fewer homeowners place their homes on the market. Combine that with the fact that many unsuccessful sellers will throw in the towel and pull their homes off of the market. Over the past five years, on average the active listing inventory has dropped by 12% from the end of August through mid-November when we transition into the Holiday Market. A 12% drop would mean that today’s 7,178 mark would decline to 6,308.

Along with the drop in the inventory, expect a significant drop in demand as well. It’s just not the best time of the year to make a move. Families generally want to make a move during the summer months. When you take into consideration that homes can take a couple of months to close, it’s no wonder that so many homes are placed under contract in the spring and close in the summer. It is much easier for kids to transition into a new school with a summer move. Moving in the middle of the school year is a lot more challenging. Over the past five years (from August through mid-November), on average demand has dropped by 10%. That represents a drop from 2,722 pending sales to 2,460.

Taking into consideration he drop in both the inventory and demand, the expected market time for newly listed homes in Orange County is expected to change very little from its current 2.64 month mark, or 79 days. That means that the overall feel of the housing market is not going to change much from where it stands today. It will remain HOT in the lower ranges, below $500,000, a seller’s market. For homes priced between $500,000 and $1,000,000, it will be a slight seller’s market towards the bottom of that range, but will be very close to a balanced market towards the top of the range. A balanced market does not favor buyers or sellers. For homes priced above $1,000,000, it will be a slow go. The expected market time is currently at 8.5 months and will not change much over the course of the Autumn Market.

The best approach for sellers is to know the current landscape of the local housing market. It’s also a given, the higher the price, the longer the home is going to take to sell. Homes are no longer flying off the market like they did months ago. There are fewer buyers looking to buy, so there will be fewer showings. There may be fewer sellers to compete with, but that will be offset by softer demand.

For sellers, it boils down to price and condition, the two factors that they have control over. For the rest of the year, many overzealous sellers will learn the hard way that they will not find success without carefully honing in on price, bringing the price as close to their Fair Market Value as possible. With less buyer competition, buyers really do not want to pay much more than the last comparable sale. Multiple offers will no longer be the norm, so buyers will not be tripping over each other to purchase a home like they did in May. Since many new sellers will hit the market overpriced, ignoring basic market fundamentals and the slower autumn season, they will sit on the market with very few showings and no offers.

The best approach for buyers is to understand that while there are fewer buyers competing to purchase, it is NOT a buyer’s market. On the contrary, for all of Orange County, it is still a slight seller’s market and will remain that way for the remainder of the year. Buyers cannot afford to be too uncompromising in their quest to find a deal. During this time of the year many buyers mistakenly feel that because it is no longer the spring or summer that it is the best time to buy, the best time to “get a deal.” Buyers that make it their mission, like so many do every year, will not be able to achieve their goal in isolating a home. The housing market is far too healthy for sellers to make exceptions and start discounting the price just because housing is not as hot as earlier in the year.

Instead, buyers really need to stick to the sound strategy of isolating the home that best fits their needs and then offering to pay close to the home’s Fair Market Value. Remember, there will still be plenty of overpriced, overly optimistic sellers looking to get a lot more than the last closed sale. They too will not find success until they lower the price and succumb to being a bit more realistic. Until then, ignore these homes and continue the search.

Ultimately, buyers and sellers will find success by being realistic and not trying to overreach. There will be plenty of buyers and sellers who will find success for the remainder of the year, but that is predicated on having the right approach.


Active Inventory:  It looks as if the active inventory has reached a peak for the year.

In the past two weeks, the active inventory has grown by only 11 homes and now sits at 7,178. Now that school has started, this level is most likely the peak for the inventory in 2015. We can expect the inventory to slowing drop over the coming months as fewer sellers enter the fray and many sellers who have not found success will ultimately throw in the towel, pulling their homes off of the market.

Last year at this time the inventory totaled 8,084 homes, 708 more than today, with an expected market time of 3.16 months, or 95 days. That’s 16 additional days compared to today.

activeinventoryYOY

Demand:  Demand decreased by 1% in the past couple of weeks.

Demand, the number of new pending sales over the prior month, decreased by 40 homes in the past two weeks and now totals 2,722 homes. Even with the increase, February levels. Demand will slowly drop for the rest of 2015.

Last year at this time there were 223 fewer pending sales, totaling 2,499.

ocdemandYOY

Distressed Breakdown: The distressed inventory decreased by 7 home in the past couple of weeks.

The distressed inventory, foreclosures and short sales combined, decreased by 7 homes in the past two weeks, a 3% drop, and now totals 219. Two weeks ago, the inventory grew by 24 homes, but that turned out to be more of an anomaly than a trend, as it quickly reversed course this week. Year over year, there are 21% fewer distressed homes today.

In the past two weeks, the foreclosure inventory increased by 4 homes and now totals 64. Less than 1% of the inventory is a foreclosure. The expected market time for foreclosures is 64 days. The short sale inventory decreased by 11 homes in the past two weeks and now totals 155. The expected market time is 56 days. Short sales represent just 2% of the total active inventory.


Have a great week.

OChousingreport1
OChousingreport2
OChousingreport3
OChousingreport4


[gravityform id=”13″ title=”true” description=”true”]

Filed Under: Roy's Blog

OC Housing Report: The Gift Continues But For How Long?

August 26, 2015 By Roy Hernandez Leave a Comment

giftbox
The Federal Reserve has kept interest rates intact for years, but it looks as if that is going to change.

Interest Rates: at 4.125%, the current interest rate is a screaming deal in historical perspective.

For years, leading economists have been hinting at interest rate hikes. For years, interest rates have remained flat, baffling economists as they scratch their collective heads wondering just how long the Federal Government can keep the short term rate at their current historical lows. So, if leading economists can get it wrong year after year, who can you believe? The answer is simple: the Federal Reserve.

The Federal Reserve has been talking about raising the short term rate and their warnings are getting louder and louder. They are most likely going to ceremoniously live up to all of their talk in raising the rate by the end of this year with one small rate hike. This will pave the way to future hikes as long as the overall economy continues along its path to improving.

The threat of an increase in interest rates has motivated buyers to step in and purchase homes at a much hotter pace compared to just one year ago. Last year, the market was incredibly flat in terms of appreciation, but not this year. This is solely due to an increase in buyer demand. There really have not been too many fundamental differences economically in comparing 2015 to 2014, yet closed residential resale homes are up 12%. So, why the jump in demand this year?

julyinterestrateoutlook

Buyers are not incompetent; they have been busy reading and listening to news reports about the Federal Reserve’s desire to raise rates. They remember when they announced that they would start “tapering” their involvement in the secondary market back in June of 2013. Up to that point they were propping up the entire secondary market. They lived up to their promise and completely backed out of the secondary market in October of last year. Now that the Federal Reserve is talking about increasing rates by year’s end, buyers have been busily purchasing real estate and locking in these historically low interest rates.

Freddie Mac (Federal Home Loan Mortgage Corporation) forecasted in July that interest rates would slowly rise over the next year, topping out at 5%. Buyers intuitively know that as rates rise, so do monthly payments. But, it is essential to drill down a little bit further and look at the actual numbers. Yes, moving from 4.125%, where rates are today, to 4.3%, their end of 2015 prediction, may seem like an insignificant change in the monthly payment, but it’s presumably just the beginning. For a detached median priced home, it’s only a $672 increase each year; and for the median priced condominium, it’s only a $396 increase.

The thing to remember is that interest rates will slowly rise. As they do, before you know it, everybody will be talking about 5% interest rates as the new normal. At 5%, the detached median sales price home now has a monthly payment that is $284 more than today’s payment. That is a difference of $3,408 each and every year. Locking in today is like getting a very nice free vacation to Hawaii every year for 30 years. At 5%, the median sales price condominium has a monthly payment that is $170 more than today’s payment. That’s an extra $2,040, still a pretty considerable chunk of change.

Just for kicks, let’s take a look at 6.5%, where rates were just prior to the Great Recession and prior to the Federal Reserve stepping in and slashing rates to their historical lows. For the detached median sales price, the payment increases by $746 per month, or $8,952 per year. Over 5 years, it is an extra $44,760, that’s equivalent to two brand new 2015 Honda Accords ($22,105 MSRP each).

For those who are too young to remember, 6.5% is actually a great rate, historically speaking. In 2000, interest rates were at 8%. In 1990, they were 10%. In 1982, it was 17%. Yes, we are all used to 4% interest rates, yet I can recall a time when we celebrated when interest rates dropped to the single digits. Here’s a cautionary warning for buyers: be careful what you get used to. While economists may have incorrectly forecasted interest rate movement in the past, listen closely to the Federal Reserve as they prepare the nation for imminent rate hikes. Buying today is a smart move because of the government’s gift of rock bottom interest rates. That gift is most likely coming to an end.

Active Inventory:  The inventory increased by only 1% in the past couple of weeks.

After sharply increasing for four straight months, the active inventory in the past two weeks only increased by 51 homes in and now totals 7,167. Since 2004, the inventory has only grown by 1% during the same two week period. That’s a direct result of fewer homes coming on the market as summer slowly draws to an end. For many of those year, the peak actually came two weeks from now, the end of August. That was last year’s peak too. It looks as if this year’s Orange County housing market will peak right around then too, about 11% lower than last year’s peak.

Last year at this time the inventory totaled 8,084 homes, 917 more than today, with an expected market time of 3.13 months, or 94 days. That’s 16 additional days compared to today.

OCactivelistinginventory

Demand:  Demand increased by 2% in the past couple of weeks.

Demand, the number of new pending sales over the prior month, increased by 64 homes in the past two weeks and now totals 2,762 homes. Even with the increase, demand is still currently at February levels. From here, we can expect demand to start to drop a bit as the kids go back to school.

Last year at this time there were 177 fewer pending sales, totaling 2,585. The threat of an increase in rates will probably keep demand slightly elevated year over year throughout the Autumn Market.

 Distressed Breakdown: The distressed inventory increased by 26 home in the past couple of weeks.

The distressed inventory, foreclosures and short sales combined, increased by 26 homes in the past two weeks, a 12% jump, and now totals 226. It’s the highest level since March of this year. But, do not get too caught up in the numbers; the year started with a distressed inventory of 262 foreclosures and short sales. The uptick is not due to an increase in foreclosures; it’s because of a spike in short sales. Short sale spikes have occurred before. The most recent one came in September of last year when it climbed by 31 in just two weeks. Once again, it’s all about perspective. There are currently 166 short sales, compared to 208 last year, 170 in 2013, 599 in 2012, and 2,935 in 2011. Historically, 166 short sales on the market is a drop in the bucket compared to prior years and the depths of the recession.

In July, only 2.6% of all closed sales were short sales and a meager 1% were foreclosures, leaving 96.4% that were good ol’ fashioned healthy sellers with equity in their homes. Even with the recent slight increase in short sales, the distressed market has become nothing more than a footnote to the current housing story.

In the past two weeks, the foreclosure inventory decreased by 3 homes and now totals 60. Less than 1% of the inventory is a foreclosure. The expected market time for foreclosures is 72 days. The short sale inventory increased by 27 homes in the past two weeks and now totals 166. The expected market time is 66 days. Short sales represent just 2% of the total active inventory.


Have a great week.

pictureone

picturetwo

picturethree

picturethree picturefour

[gravityform id=”13″ title=”true” description=”true”]


Filed Under: Roy's Blog

OC September 2015 Calendar of Events

August 17, 2015 By Roy Hernandez Leave a Comment

September 13 – November 1, Oktoberfest

Eat, drink, dance and be merry at Southern  California’s best and most diverse Oktoberfest (voted by German World Magazine). There will be live Oom-Pah-Pa Bands directly from Germany. Get your prost on with one of your favorite imported  German beers, bratwurst, rotisserie chicken, hamburgers, pork sandwiches,  strudel, pretzels and so much more. There will also be beer drinking and stein holding contests,  and of course the chicken dance!

Time: Refer to website for full schedule of events

Location: Old World Festival Hall,

7561 Center Ave., Huntington Beach For more information: www.oldworld.ws/oktoberfest-orange-county.html


September 4 – 6, International Street  Fair

ocstreetfaire


ocstreetfaire2


This street fair includes International  foods, crafts, folk dancing and music! There will be many different ethnic foods and costumes.  This street fair has become  known for the variety of food reflecting cuisine from around  the world.

Time: Fri: 5:00 pm – 10:00 pm, Sat/Sun: 10:00 am – 10:00 pm

Location: Plaza Square Park, Orange

For more information:  www.orangestreetfair.org


September 10, CaterCon

This expo has been specially designed  for all consumers  of event services. CaterCon  will offer a unique opportunity to sample delectable  cuisine, wine and beer from popular local caterers,  network  with event professionals,  learn the latest trends in professional event services, meet with hosts of local venues and hotels and experience the music of local entertainers.

Time: 3:00 pm – 8:00 pm

Location: 1960 S Anaheim Way, Anaheim

For more information:  www.CaterCon.com


September 12, Orange  County Beer Festival

This year there will be over 80 breweries serving over 175 craft and import beers plus awesome food, live entertainment, and beer seminars. This is one beer fest where you won’t feel like you are choosing from the same brands you can get in your grocery store. No one under the age of 21 will be admitted. This event is to raise thousands of dollars for the Fallen Fire Fighters Relief Fund.

Time: 1:00 pm – 4:00 pm

Location: Oak Canyon Park,

5305 Santiago Canyon Rd., Silverado

For more information:  www.ocbrewhaha.com


September 12, Annual Southern California Brain Tumor Walk The Southern  California Brain Tumor Walk is an inspirational, all- ages fundraising walk and community day to support  the brain tumor cause. Form a team of family, friends and co-workers and help make a difference in the fight against brain tumors!

Time: 9:00 am

Location: Angel Stadium, 2000 Gene Autry Way, Anaheim

For more information:

www.events.braintumor.org/orange-county-brain-tumor-walk/


September 12 – 13, Tall Ships Festival

tallshipsThis festival features  a spectacular  array of family-fun activities including live music, art shows and a variety of tasty food. Interactive living-history encampments including blacksmiths, scrimshaw artists, and the infamous Port Royal Privateers are sure to entertain and amaze guests of all ages and are not to be missed. Additionally, you can explore the historic tall ships and listen to the crew share tails of adventure and life at sea.

Time: Refer to website for specific schedule

Location: Dana Point Harbor, 34100  Selva Rd., Dana Point

For more information:  www.tallshipsfestival.com


September 18 – 20, Brea Jazz Festival

breajazzfestivalThe Brea Jazz Festival is a crowd favorite! The outdoor event draws well over 12,000 people during the weekend for a musical jazz extravaganza in the month  of September. People can bring chairs to watch the festival from a vantage  point. There will be a beer and wine garden,  VIP seating area, fine arts and craft show and even a kid’s zone.

Time: 1:00 pm – 5:00 pm

Location: Downtown Brea

For more information:  www.breadowntown.com


September 19 – 20, Surf City Days

Spend this weekend at Huntington Beach Downtown and engage in your favorite activities as a participant  or spectator. Join the 44th Annual Surf Competition, Duke’s CBVA Volleyball Tournament, HSS/Surfline Demo Days, Race to Victory SUP, Old Skool Skate Competition, Green Forum, Green Expo, the California FIT Challenge and Surfin’ Sundays. Time: 8:00 am – 5:00 pm

Location: Huntington Beach Pier

For more information: www.hbdowntown.com/surf-city-days.html


September 19 – 20, Dozynki  Harvest Festival Celebrate  Polish culture with music, dancing,  food and exhibits. This festival is a celebration  of thanksgiving that remains a long-standing tradition in Polish communities throughout the world!

Time: Sat: 12:00 pm – 11:00 pm, Sun: 11:00 am – 4:00 pm

Location: Polish Center,  3999 Rose Dr., Yorba Linda

For more information:  www.polishcenter.org


September 19 – 21, St NorbertFest

The annual St. Norbertfest  (formerly Oktoberfest)  continues  to grow and helps to build the parish, school, and the Orange community. There will be great food, fun and games such as Sumo Mania, bingo, raffles, exciting rides and awesome entertainment for everyone!

Time: Refer to website for times

Location: 300 E. Taft Ave., Orange

For more information:  www.stnorbertchurch.org


September 25 – 27, Greek Festival

Greekfestival

Be Greek for the day! Enjoy authentic Greek food and pastries, live Greek music and dancing,  shopping  at the Greek bazaar, kid friendly activities and exhibits featuring  Byzantine icons and traditional Greek costumes.  This is a free event.

Time: Fri: 5:00 pm – 10:00 pm,

Sat: 11:00 am – 11:00 pm, Sun: 11:00 am – 9:00 pm Location: 27129  Calle Arroyo, San Juan Capistrano For more information:  www.sjcgreekfest.org


September 26, J.F. Shea Therapeutic Riding Center

Annual BBQ and Family Faire

Traditional family barbecue in a casual setting featuring  live country western  entertainment, activities for children, live and silent auctions and riding demonstrations throughout the evening. Country western  wear is encouraged! All proceeds benefit the programs  of the J.F. Shea Therapeutic Riding Center dedicated to improving the lives of persons with disabilities through horsemanship.

Time: 4:00 pm

Location: 26284  Oso Rd., San Juan Capistrano

For more information:  www.sheacenter.org


September 26, Cruisin’ For A Cure Car Show

The world’s largest one-day charity car show dedicated to helping find a cure for Prostate Cancer. There will be over 3,500  vehicles on display, live music, food and over 200 vendors and exhibitors. Time: 7:00 am – 4:30 pm

Location: OC Fair and Expo Center,  Costa Mesa

For more information: www.cruisinforacure.com


September 26, Irvine Global Village Festival

globalvillageBoasting artistic cultural performances on five stages,  this festival’s live entertainment is a mosaic of music and dance representing more than 50 cultures from Europe, Asia, Africa, and North and South America. Immerse yourself in cultural displays, world religion and demonstrations, indulge in

international cuisine, explore the world marketplace and keep the little ones in motion with hands-on art projects, games and activities in a giant, interactive kids village. This is a free event. Time: 10:00 am – 6:00 pm

Location: Bill Barber Park, 4 Civic Center Plaza, Irvine

For more information:  legacy.cityofirvine.org/globalvillage/


September 26 – 27, Fascination  of Orchids Show

One of the largest orchid shows in the world. In addition to many orchid lectures, there will be over 100 orchid exhibits and thousands of orchids available for purchase  from worldwide growers.  This is a free event.

Time: 10:00 am – 5:00 pm

Location: South Coast Plaza Village, Costa Mesa

For more information:  www.ocorchidshow.com


MDC © 2015 Lawyers Title. Information  contained  in this document has been compiled  from a variety of sources and is accurate as of print date. Info subject to change  without notice.  Please contact  each listing directly with questions.

[gravityform id=”13″ title=”true” description=”true”]


Filed Under: Roy's Blog

The Worst Things You Can Do Before Buying a Home

August 12, 2015 By Roy Hernandez Leave a Comment

worst-things-mortgage-680x430

Cynics may scoff, but getting under contract on the right home can turn even the most stoic shopper into a bit of a dreamer. From paint colors to planting a garden, picturing yourself in that property is critical for many buyers. But leave a little room for pragmatism. Remember that getting pre-approved for a mortgage and even under contract isn’t a guarantee. That prefix is there for a reason. Loan pre-approval is not loan approval. You’ll have more hurdles to clear before a lender legally commits to funding your home loan. Buyers who don’t know any better can inadvertently add obstacles to that path – or even kill the entire deal – between contract and closing day.

1. Go Credit-Crazy

    It’s almost become cliché in the mortgage industry, but the warning still bears repeating: Don’t buy a truckload of furniture until after your loan closes. The prohibition goes beyond sofas and settees – avoid obtaining credit for any major expense, like a car, a boat or, yes, a new bedroom set. Be careful with even minor expenses. If you absolutely need to obtain new credit or accrue debt before closing, talk with your loan officer as soon as possible. New payments are going to affect your monthly debt-to-income ratio (and residual income on a VA loan), and not in a good way. Hard inquiries on your credit report could also lower your credit score. That might hurt your interest rate if you haven’t locked or even knock you out of qualifying range all together.

2. Shuffle Dollars & Cents

    Lenders will scour your most recent bank statement as part of the pre-approval process. It’s not like they forget about it after that. They’ll take another look at your assets and bank records again during the underwriting process. You’ll need to explain any unusual deposits or withdrawals. Lenders will require clear documentation and a paper trail if you’re putting gift funds toward a down payment or closing costs. Stuffing a wad of undocumented cash into your account is going to raise some red flags.

3. Get Behind on Bills

    Having a late payment hit your credit report before closing can devastate your deal. Payment history comprises about a third of your credit score. One solitary 30-day late payment can clip 60 to 110 points from your credit score. Maybe not a huge deal if you had an 800 score, right? Possibly. But if that 30-day late blemish is a mortgage or rent payment, some lenders will boot your application altogether. Many will require at least 12 consecutive months of on-time payments in order to qualify for a home loan.

4. Co-Sign on a Loan

    Co-signing a loan is arguably a bad financial move whenever you make it. But it’s especially risky during the mortgage lending process. It means you’re financially liable for someone else’s debt. Yes, that someone else might be the most responsible person on the planet. Lenders will still need to factor that new monthly obligation into your overall affordability profile. Adding one more debt to the list could stretch too thin your debt-to-income ratio and assets.

5. Changes in Employment

    Probably goes without saying, but losing your job is going to be a big problem. Even job-hopping can present some major hurdles. Lenders crave stable, reliable income that’s likely to continue. Lenders are likely to slam on the brakes if you take a new job in a different field. Or if you decide to start your own business. Or even if you get a promotion but see some or all of your income shift to a commission basis. The bottom line: Any change to your employment is significant. Keep your loan officer in the loop, and ask questions when in doubt. The last thing you want is to waste time and money on a home loan you’re never going to get.

[gravityform id=”13″ title=”true” description=”true”]


Filed Under: Roy's Blog

Easy Way to Find the Perfect Real Estate Agent.

August 7, 2015 By Roy Hernandez Leave a Comment

Perfect-KCMThere is a plethora of real estate information available today in the news and on the internet. It can be extremely confusing at times.

If you are thinking of buying or selling, you need an agent who can help make sense of this rapidly evolving housing market. You need an agent who can help you price your home correctly at the beginning of the selling process. You need an agent who can help you determine what to offer on your dream home without paying too much or offending the seller with a low-ball offer.

Dave Ramsey, the financial guru advises:

“When getting help with money, whether it’s insurance, real estate or investments, you should always look for someone with the heart of a teacher, not the heart of a salesman.”

Hiring an agent who has their finger on the pulse of the market will make your buying/selling experience so much easier.

But, how do you identify which agents truly understand what is happening and will take the time to simply and effectively explain what it means to you and your family?

One simple way is to check out the agent on social media. What are they posting on Facebook and Twitter? Are they using their social media platforms to share relevant, helpful information or are they just posting cherry pie recipes and cartoons? The best agents are committed to educating the consumer so they can feel confident when they are buying or selling a home.

What they are posting online will help you determine which agents meet the criteria that Dave Ramsey suggested you look for: someone with the heart of a teacher! In other words, someone that sincerely cares about your BEST INTERESTS! Not their EGO!

[gravityform id=”13″ title=”true” description=”true”]

Filed Under: Roy's Blog

OC Housing Report August 2015: Here We Grow Again!

August 3, 2015 By Roy Hernandez Leave a Comment


pricesupinOC
Part of the normal summer housing cycle, the active inventory continues to grow without pause.

A Growing Inventory: the active inventory has grown by 42% since the beginning of the year.

Quietly, one house at a time, the active inventory has been growing. In order for the inventory to rise, homes have to come on the market faster than they are coming off. Homes come off the market for one of two reasons: either they are placed into escrow or a seller opts to pull their home off of the market. So, in order for the inventory to blossom from 5,000 homes at the beginning of 2015 to 7,116 homes today, homes have to sit on the market without success.

But how can that occur when we have heard so much about the extremely hot market this year? Quite simply, too many overzealous homeowners inaccurately priced their homes outside of reality and sat on the market until they came to their senses. It’s no wonder that 10% of the housing inventory in Orange County reduces their asking price each and every week.

Don’t get me wrong; the market is a lot stronger this year compared to last year. There were a similar number of homes placed on the market so far this year compared to last year, but the active inventory last year was 6% higher. The inventory was higher because demand was not as strong during the Spring Market. When fewer homes are placed into escrow, the inventory rises.

In spite of the robust market, the inventory is still rising. A hotter market is not a free pass to price a home wherever a seller wishes. Those sellers realize the error in their ways after sitting on the market without reviewing a single offer. Now that summer is almost over, the Orange County housing market is beginning its annual transition into the Autumn Market. Have you seen more Open House directional arrows at busy cross streets? That’s a definitive sign that there are fewer buyers in the marketplace, that homes are not selling as quickly, and that too many homes are not priced accurately.

April 9th of this year was the absolute peak of the spring selling season. The expected market time was at 1.81 months, or

currentarchives080315

54 days. The market was a very hot seller’s market and prices were rising, homes were flying off of the market, and offers were coming in above the listing price. Since then, the inventory has grown by 27%, 1,792 homes, and demand has dropped by 13%, or 409 pending sales. When supply rises and demand drops in housing, the expected market time that it would take for the average home to be placed into escrow rises, the higher the expected market time, the slower the overall market. It has climbed to 2.64 months, or 79 days, moving from a deep seller’s market to a slight seller’s market.

The expected market time is marching its way to three months. When it is between three and four months, it is a balanced market, one that does not favor a buyer or seller. At its current level, sellers are able to call the shots, but appreciation has slowed to a crawl. Without appreciation, proper pricing is vital in order to succeed. At this point, sellers wishing to stretch the price will simply sit on the market until they finally wake up to the reality that they are overpriced and will attract no offers.

Success today can be achieved a lot swifter with the sound strategy of pricing a home as close to its Fair Market Value. This cannot be determined by any online tool or valuation calculator, as they can be off by 20%, or even more. Instead, it is best to utilize the expertise of a seasoned REALTOR®, an expert who is able to take into consideration location, condition, upgrades and amenities, carefully comparing a home to the most recent pending and closed sales activity to determine the price.

The bottom line: price is the determining factor in successfully selling and stretching the price is a strategy that will not work for the remainder of 2015.

Active Inventory:  The inventory increased by 7% in the last month.

The active inventory increased by 469 homes in the past month and now totals 7,116. October of 2014 was the last time the inventory was above the 7,000 home mark. Last year at this time the inventory totaled 8,057 homes, 941 more than today, with an expected market time of 3.16 months, or 95 days. That’s 16 additional days compared to today.

From here we can expect the listing inventory to continue to grow through the end of the summer before turning lower in September as fewer homes come on the market and sellers start to throw in the towel with both the Spring and Summer Markets in the rearview mirror.


OCactivelistinginventory

Demand:  Demand decreased by 9% in the past month.

Demand, the number of new pending sales over the prior month, decreased by 271 homes in the past month and now totals 2,698 homes, its lowest level since February. Demand will remain at these levels for the remainder of summer before it downshifts again after the kids go back to school.

Last year at this time there were 149 fewer pending sales, totaling 2,549. The year over year difference has diminished substantially. On July 2nd there were 492 more pending sales compared to 2014, 20% more. The current difference is the smallest since February, just 5%.

 Distressed Breakdown: The distressed inventory increased by 12 home in the past couple of weeks.

The distressed inventory, foreclosures and short sales combined, increased by 12 homes in the past two weeks, but for the month it is actually down by nine. Year over year, there are 31% fewer distressed homes today. With a sharp turnaround in prices in the past few years the number of distressed homes has fallen appreciably. Only a few percent of all mortgaged homes are upside down. During the Great Recession, the number was as high as 25% of all mortgage homes. The distressed market has been reduced to an asterisk of the current Orange County housing scene.

In the past two weeks, the foreclosure inventory increased by 10 homes and now totals 68. Less than 1% of the inventory is a foreclosure. The expected market time for foreclosures is 51 days. The short sale inventory increased by 1 homes in the past two weeks and now totals 139. The expected market time is 48 days. Short sales represent just 2% of the total active inventory.

 Have a great week.

[gravityform id=”13″ title=”true” description=”true”]

Filed Under: Roy's Blog

OC Housing Report: Mid-Year Checkup

July 22, 2015 By Roy Hernandez Leave a Comment

housing check upOrange County Housing Report: A Mid-Year Checkup

July 20, 2015

Good Afternoon!

Now that half the year has passed, it is best to take a look at where
we have been, where we are now, and where we are headed from here.

Housing Checkup: every once in a while it is a great idea to take a step back and evaluate the health of the current market and the latest trends. By now everybody is acutely aware that 2015 has been an extremely hot year for housing with values rising, not enough homes on the market, and way too many competing offers. While that may describe the first half of the year, where are we headed for the second half? Is it more of the same or will the market change?

Let’s take a moment and step back from the crazy real estate scene. With a stethoscope, thermometer, and blood pressure cuff in hand, here’s the latest trends and pulse of the Orange County housing market:

• The active listing inventory is climbing towards, but will remain below, the long term average. After starting the year at 5,000 homes on the market, the active inventory has climbed by 1,935 homes, a 35% rise. It is currently knocking on the door of 7,000 homes. Last year that level was surpassed in May and had been rising the entire year without pause. With stronger demand, this year has been a bit different. Nearly the same number of homes have come on the market, but more have come off the market and achieved success. There are 11% fewer homes on the market today compared to 2014, but 30% more compared to 2013. It will probably tap out at around 7,500 homes at the end of August, about 1,000 shy of Orange County’s long term average. From there it should start to fall as homeowners throw in the towel and we transition into the Autumn Market. The inventory is rising on the backs of overzealous, overpriced sellers who will not achieve success until they are priced right.

• Homeowners with equity, “Equity Sellers,” dominate the Orange County real estate scene. For the first half of 2015, equity sellers represented 95% of all closed sales. Distressed homes dominated Orange County real estate just a few years ago. While there still may be some homeowners struggling, distressed sales have become nothing more than an asterisk in a much healthier market. Much has been made of adjustable rate resets and many other old wives’ tales that detail an increase in distressed home activity; instead, the market has become even more stable. Because of considerable appreciation, the number of underwater homes in Orange County has been reduced to 3% of all residence with a mortgage. Armed with a much healthier equity position, good ol’ fashioned homeowners have been encouraged to place their homes on the market.

• Total closed sales are up. For the first half of the year there have been 15,158 closed sales, up 10.5% from last year when there were 13,717. Sales this year are only off by 350 closed sales compared to 2013. What’s changed? It’s not distressed sales. Those are down by 15%, or 332 fewer short sales and foreclosures combined. The change comes is due to a sharp increase in equity sales, which are up by an extra 1,573, or 12%, compared to last year. This healthy trend shows no signs of letting up, but will adhere to a normal Orange County housing cycle. Sales will start to drop as we move into August, and they will downshift further as the kids go back to school.

• Sellers have been getting away with stretching the price. Sellers were able to get away with overpricing their homes for the first half of 2015, but that phenomenon is coming to an abrupt halt after transitioning into the Summer Market. Demand has dropped a bit with all of the distractions of summer. As a result, sellers are having a much harder time obtaining offers when they are overpriced. As the market downshifts, buyers move away from a willingness to pay any price just to obtain a home, to a strong desire to pay the Fair Market Value for a home, a value determined by the most recent pending and closed sales. Homes that are priced right and are in good condition will fly off the market. The latest trend is that sellers are not getting away with overpricing; instead, they are sitting on the market with no offers. Consequently, the inventory is rising and 10% of the active inventory is decreasing their asking price each and every week.

• The expected market is rising. The expected market time takes into consideration the total inventory and current demand. A rise in inventory pulls the expected market time up. Stronger demand pushes the expected market time down. Demand peaked back in May and has since dropped by 10%. The inventory has been rising. As a matter of fact, its biggest increase came in the past two weeks. With demand dropping and inventory rising, the expected market time has been on the rise as well. The expected market time was at less than two months during the spring. When it is below two months, it is a deep seller’s market with dramatic appreciation. But, it has been climbing substantially over the past month and is now at 2.5 months. At that level it is a seller’s market with only slight appreciation. From here, the expected market time will continue to rise and will surpass the three month mark by the end of summer, a balanced market where it does not favor sellers or buyers. It will be balanced for the rest of the year.

• The luxury market is back. Home sales above $1 million are up 21% compared to last year. There have been 2,114 closed sales versus 1,747 last year. Actually, the last time luxury sales have been this good was back in 2005 when there were 2,291 closed sales. Luxury sellers should not get too excited though. While there have been 2,114 closed sales for the first half of 2015, there are 2,333 active listings priced above $1 million today. The current expected market time based on today’s demand is a staggering 7.86 months. Last year at this time the expected market time was 5.72 months, 27% less. While the luxury end may have started the year strong, it has since cooled off substantially and this trend could continue as we move into the slower months of the year for real estate.

• Interest rates are flat. The Federal Reserve announced that they were considering raising the Federal Funds Rate sometime this year, but after reading the tea leaves, they have made no move thus far. Based upon international economic turmoil between the Greek crisis and China’s stock market crash, it doesn’t appear as if the Federal Reserve wants to rock the U.S. economic boat, so will most likely leave rates alone. They may make a small token move at the end of the year, more of a gesture than any significant change. So, it looks as if the government gift of unbelievably, historical low interest rate levels is here to stay for the remainder of the year.

Inventory YOY

Active Inventory:  The inventory increased by 4% in the last couple of weeks.The active inventory increased by 288 homes in the past two weeks and now totals 6,935. Last year at this time the inventory totaled 7,826 homes, 891 more than today, with an expected market time of 3.13 months, or 94 days.

 Demand:  Demand decreased by 5% in the last couple of weeks.Demand, the number of new pending sales over the prior month, decreased by 159 homes in the past two weeks and now totals 2,810 homes, its lowest level since the beginning of March. This is part of typical summer market where demand drops with all of the distractions of summer.

Last year at this time there were 309 fewer pending sales, totaling 2,501.

 Have a great week.

Housing checkup pic1

Housing checkup pic2Housing checkup pic3

Filed Under: Roy's Blog

  • « Previous Page
  • 1
  • …
  • 4
  • 5
  • 6
  • 7
  • 8
  • …
  • 14
  • Next Page »

RoyaltyAgent@gmail.com

Search All Houses FOR SALE

Hot Bank Foreclosures & REO

Current Mortgage Rates

[mlrates state="CA" size="narrow"]

Fullerton Homes FOR SALE by Price

$300,000- $500,000
$500,000- $700,000
$700,000- $900,000
$900,000- $1,100,000
$1,100,000 and above

Fullerton Condos FOR SALE by Price

$200,000- $300,000
$300,00- $400,000
$400,000 and above

Our Coverage Areas

Brea Homes FOR SALE

Brea North Hills FOR SALE

Whittier Homes FOR SALE

Fullerton Homes FOR SALE

Placentia Homes FOR SALE

La Habra Homes FOR SALE

Yorba Linda Homes FOR SALE

Anaheim Homes FOR SALE

Brea Special Events

Community Reports

downtown brea

City Information


Brea

Yorba Linda

Placentia

Fullerton

La Habra

Tag Cloud

Anaheim Hills real estate for sale Anaheim house for sale bank owned Brea bank owned for sale Brea community info Brea foreclosure for sale Brea house for sale Brea houses for sale Brea real estate Brea real estate for sale Brea REO Brea REO for sale buyer real estate news foreclosure for sale Fullerton house FOR SALE Fullerton houses for sale Fullerton real estate Fullerton Real Estate For Sale fullerton resort living housing data housing market housing news la habra houses for sale La Habra real estate for sale north orange county for sale north orange county real estate orange county housing info orange county real estate Orange county real estate for sale orange county shadow inventory placentia condos for sale placentia for sale placentia homes for sale placentia houses for sale placentia real estate real estate information real estate news orange county REO for sale REO property for sale seller information whittier houses for sale Yorba Linda for sale Yorba Linda homes for sale yorba linda houses for sale Yorba Linda real estate for sale
The Virtual Realty Group
Roy Hernandez
cell/text (949) 922-3947
RoyaltyAgent @ gmail.com
RoyalAgent.net
BRE#01202958
  • Blog Page
  • I’d like to sell my house
  • About

Copyright © 2025 Website by The Burrell Group · Log in