• Home
  • Buyers
    • Buyer’s Guide
    • For Buyers
    • Buyer Wish List
  • Sellers
    • Seller’s Guide
    • For Sellers
    • Property Updates
    • Marketing & Listing Proposal 2019
    • Prepare your house For Sale
    • How much is my house worth today?
  • City Info
    • Search All Towns USA
    • Community Reports
    • Anaheim
    • Brea
    • Orange
    • Fullerton
    • La Habra
    • Placentia
    • Santa Ana
    • Yorba Linda
  • News
  • Schools
  • Contact Us

Roy Hernandez Real Estate Services

Orange county real estate houses for sale

You are here: Home / Archives for Roy Hernandez

OC Housing Report: Slim Pickens

June 30, 2017 By Roy Hernandez Leave a Comment

Story and graphics compliments of Steven Thomas, QEDS

Hello!

For years now the Orange County housing inventory has been
low, but this year it is more pronounced.

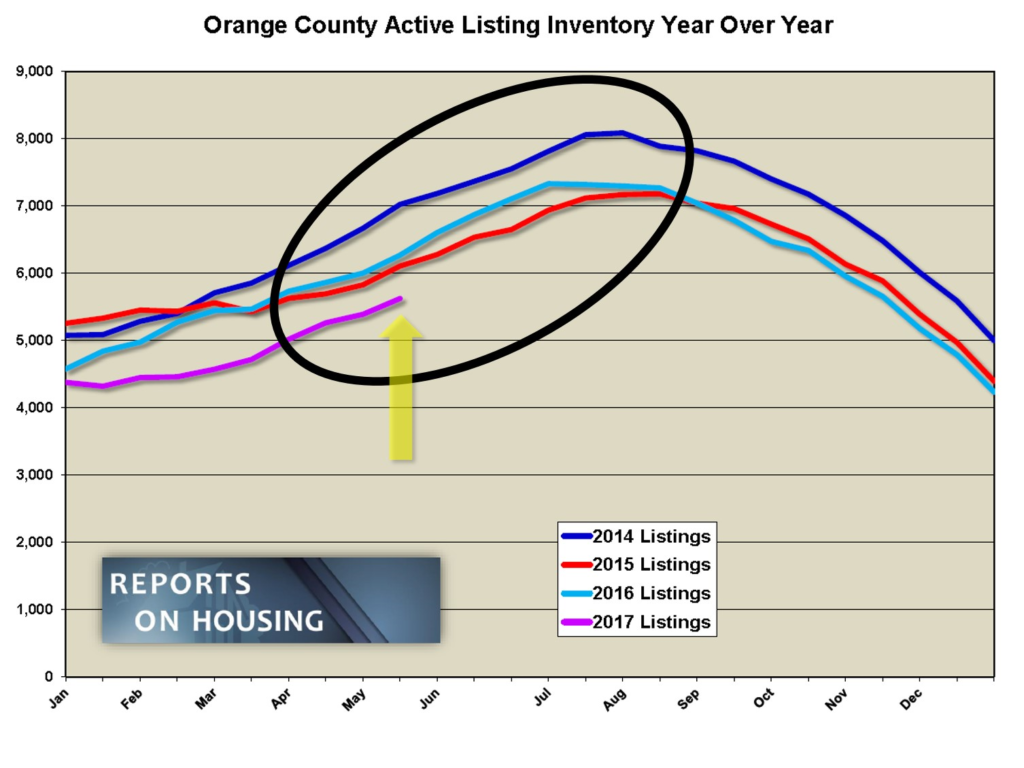
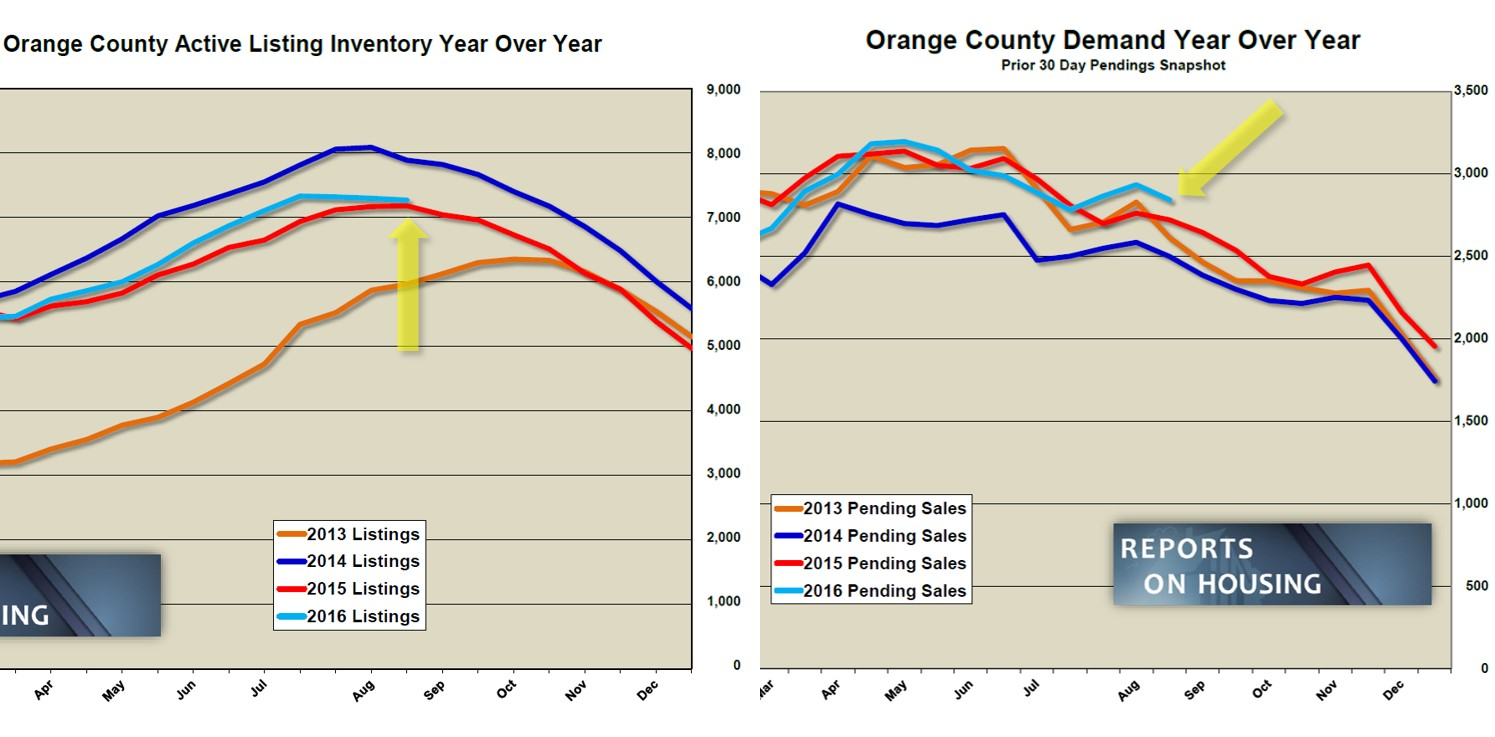
Low Supply: The active listing inventory has been down all year and it is currently off by 14% compared to 2016. 

Whew! It is tough to be a buyer looking for a home in today’s market. The biggest complaint has to be that there are simply not enough choices. In fact, nearly 1,200 fewer homes have come on the market so far this year compared to last year. The active inventory currently sits at 5,905 homes; that is 14% fewer than the 6,868 that were available last year.

The trend of fewer homes hitting the market dates back to the beginning of the Great Recession, 2008. Ever since then, fewer and fewer homeowners have placed a FOR SALE sign in their yard. This trend is nothing close to a blip on the radar screen. Something happened to everybody’s collective psyche during the drawn out and bruising recession. Homeowners are staying put.

This year has been off from last year, averaging 222 fewer homes placed on the market each month. As the half way point for the 2017 housing market rapidly approaches, the slower pace has added up. Buyers who have been working hard to secure a home without any luck can attest to the need for additional choices. Yet, the 222 year over year difference is nothing compared to the number of homes on the market during the first decade of the 2000’s. In 2006, there were 2,239 additional homes FOR SALE coming on each and every month. That added up to an additional FOR SALE sign in just about every neighborhood on a monthly basis.

Story and graphics compliments of Steven Thomas, QEDS


Price is determined by supply and demand. Just for kicks, imagine that demand remained the same. When the same number of buyers are interested in purchasing a home, yet the supply drops considerably, the highest bidder wins. As a result, prices rise. Essentially, that is what has happened over the past five years. In 2012, demand spiked; however, there were not enough homes on the market to satiate the voracious appetite for buyers to buy. Home values have been on the rise ever since.

In past housing run-ups, homeowners have been encouraged and enticed to join the fray, eager to cash in on the market and make a move. That has not been the case during the current five year run. Homeowners have not been tempted to sell like they did from 2000 through 2007.

ADVICE FOR BUYERS: be realistic out of the gate. Don’t delay in pulling the trigger to write an offer to purchase a home. You do not have to overpay, especially now that the housing has transitioned into the Summer Market. Offer the FAIR MARKET VALUE for a home. Most of all, pack your patience.

ADVICE FOR SELLERS: be realistic out of the gate. Far too many seller hit the market overpriced. The market has been on the rise, but it does a majority of its annual appreciation during the Spring Market. Homes appreciate at a much slower rate for the rest of the year. Orange County detached housing values have been increasing at a pace of about 5% per YEAR. That is 365 days, not 30 days. So, price accordingly. A wise strategy is to price a home at its FAIR MARKET VALUE. The better the price, the more activity that is generated. Multiple offers drive the sales price up.

Active Inventory: The active inventory increased by 3% in the past couple of weeks.
The active listing inventory added an additional 148 homes in the past two-weeks, a 3% increase, and now sits at 5,905. Within the next couple of weeks, the inventory will eclipse the 6,000 home mark. Last year that occurred at the start of May.

We can expect the inventory to continue to rise throughout the Summer Market until it reaches a peak somewhere around mid-August. From there, the market will transition into the Autumn Market, from mid-August through Thanksgiving, with fewer homes coming on the market with both the spring and summer in the rearview mirror.

Last year at this time, there were 6,868 homes on the market, 16% more than today.

Story and graphics compliments of Steven Thomas, QEDS


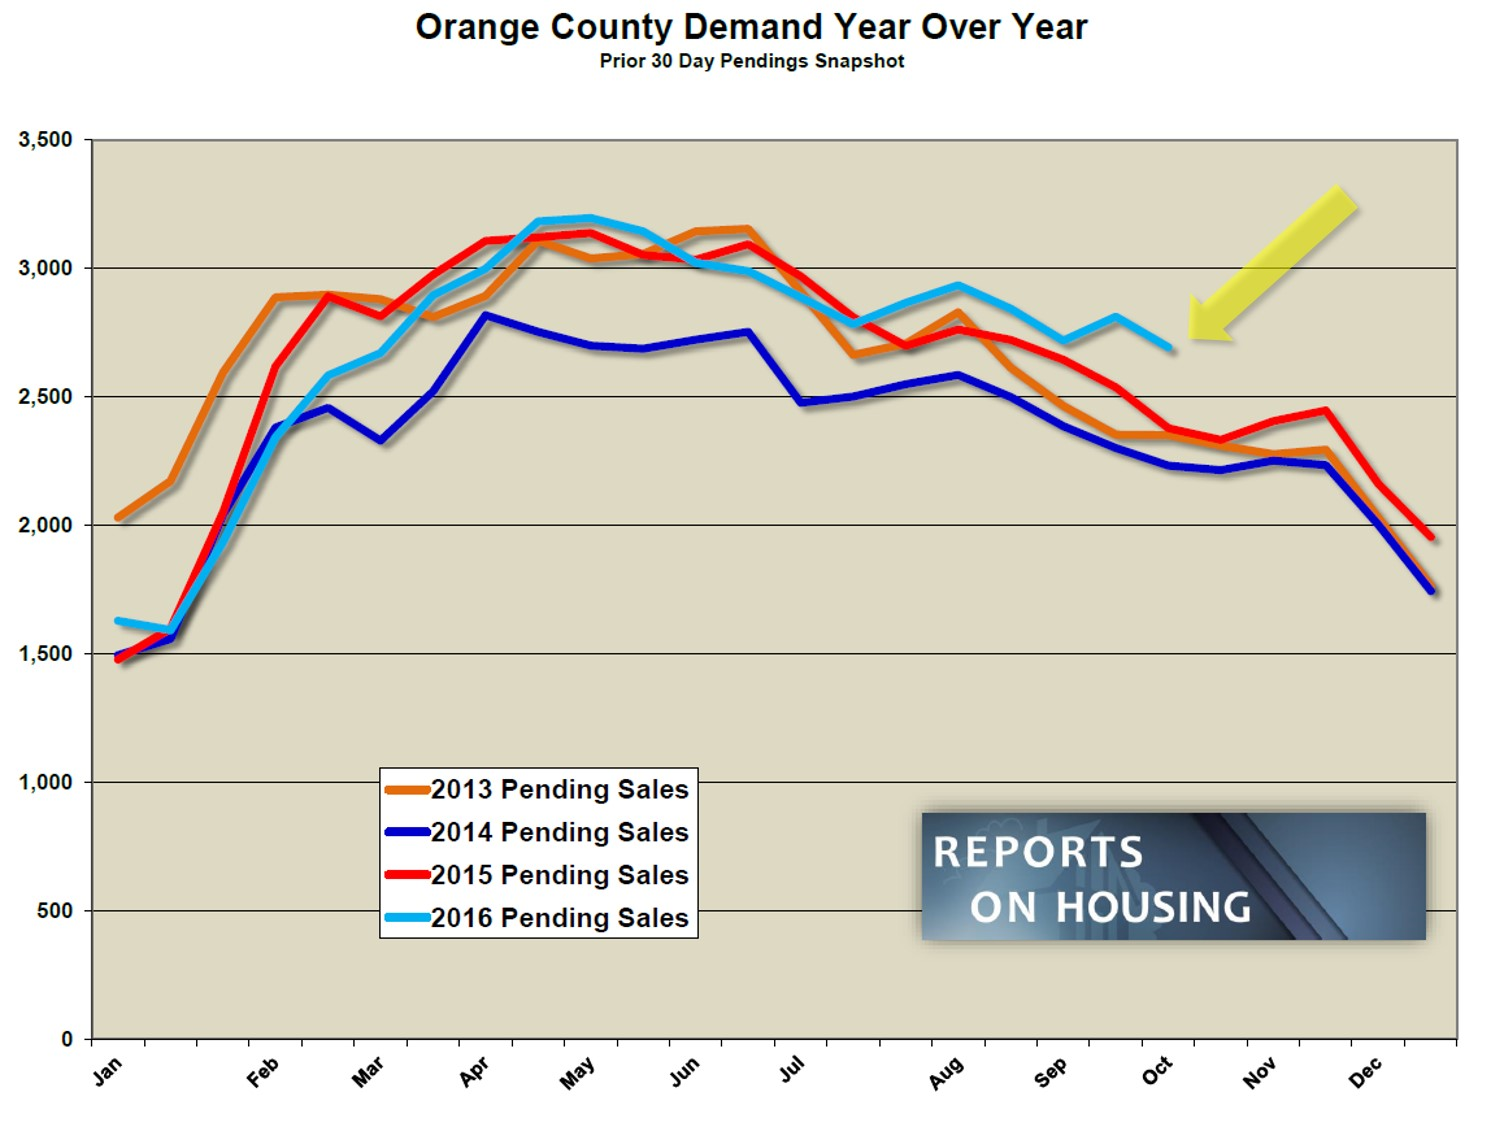
Demand: Demand increased by 1% in the past couple of weeks.
Demand, the number of homes placed into escrow within the prior month, increased by 33 pending sales in the past two-weeks and now totals 2,937, a 1% increase. Demand is off the most in the entry-level market, homes priced below $500,000. With 23% fewer homes that have been placed on the market so far this year below $500,000, demand is now off by 21%. This market has been underperforming all year due to a real lack of inventory.

We can expect demand to drop slightly from now through the end of the Summer Market.

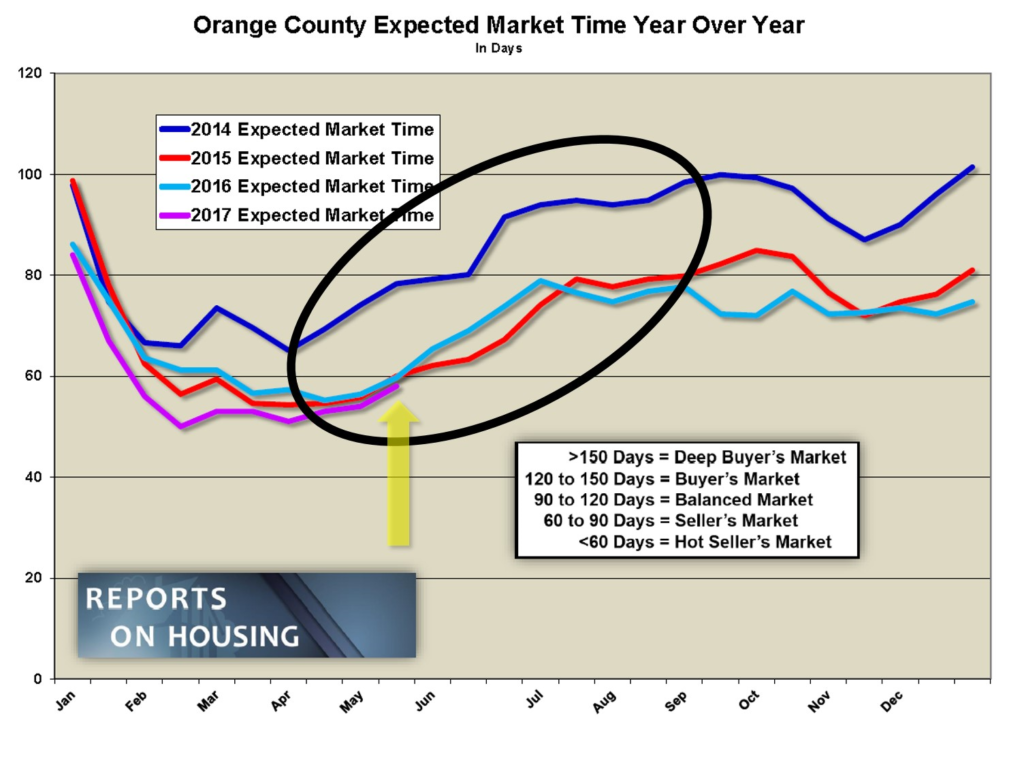
Last year at this time, there were 52 more pending sales totaling 3,989, or 2% more. The expected market time increased from 59 to 60 days in the past couple of weeks. At 60 days, the market is no longer a HOT seller’s market, but a tepid seller’s market with muted appreciation. Last year it was at 69 days.

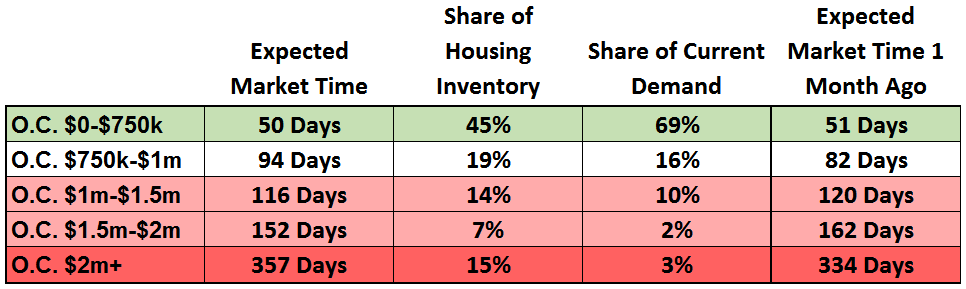
Luxury End: Luxury demand increased by 6% in the past couple of weeks while the inventory grew by 2%.
In the past two weeks, demand for homes above $1.25 million increased from 351 to 371 pending sales, a 6% increase and nearly the same level as a month ago. The luxury home inventory increased from 1,981 homes to 2,011, up 2%. Even with the increase in demand, the luxury market is NOT a robust seller’s market, taking months in order to find success.

For homes priced between $1.25 million and $1.5 million, the expected market time decreased from 108 to 96 days. For homes priced between $1.5 million to $2 million, the expected market time increased from 144 to 148 days. In addition, for homes priced above $2 million, the expected market time decreased slightly from 256 days to 253 days. At 253 days, a seller would be looking at placing their home into escrow around the end of February of next year.

Story and graphics compliments of Steven Thomas, QEDS

Orange County Housing Market Summary:

• The active listing inventory increased by 148 homes, or 3%, in the past couple of weeks, and now totals 5,905, knocking on the door of the 6,000 home level. Last year, there were 6,868 homes on the market, 963 more than today.

• There are 35% fewer homes on the market below $500,000 today compared to last year at this time and demand is down by 21%. Fewer and fewer homes and condominiums are now priced below $500,000. This price range is slowly disappearing.

• Demand, the number of pending sales over the prior month, increased by 1% in the past couple of weeks, adding 33 pending sales and now totals 2,937. The average pending price is $845,004.

• The average list price for all of Orange County remained at $1.6 million. This number is high due to the mix of homes in the luxury ranges that sit on the market and do not move as quickly as the lower end.

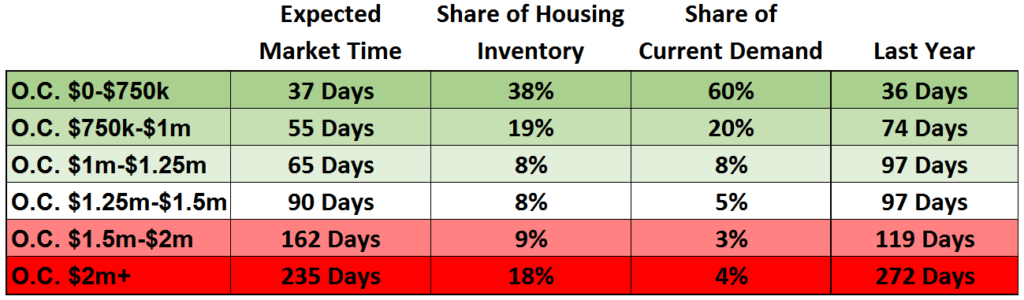
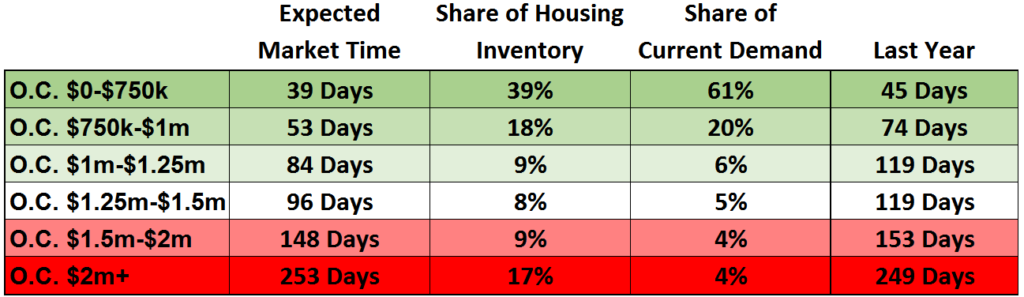
• For homes priced below $750,000, the market is HOT with an expected market time of just 39 days. This range represents 39% of the active inventory and 61% of demand.

• For homes priced between $750,000 and $1 million, the expected market time is 53 days, a hot seller’s market (less than 60 days). This range represents 18% of the active inventory and 20% of demand.

• For homes priced between $1 million to $1.25 million, the expected market time is at 84 days, a tepid seller’s market.

• For luxury homes priced between $1.25 million and $1.5 million, the expected market time decreased from 108 to 96 days. For homes priced between $1.5 million to $2 million, the expected market time increased from 144 to 148 days. For luxury homes priced above $2 million, the expected market time decreased from 256 to 253 days.

• The luxury end, all homes above $1.25 million, accounts for 34% of the inventory and only 13% of demand.

• The expected market time for all homes in Orange County increased from 59 days to 60 in the past couple of weeks, changing from a hot seller’s market to a tepid seller’s market (60 to 90 days). From here, we can expect the market time to slowly rise throughout the Summer Market.

• Distressed homes, both short sales and foreclosures combined, make up only 1.2% of all listings and 2.1% of demand. There are only 25 foreclosures and 46 short sales available to purchase today in all of Orange County, that’s 71 total distressed homes on the active market, 5 fewer than two weeks ago. Last year there were 138 total distressed sales, 94% more than today.

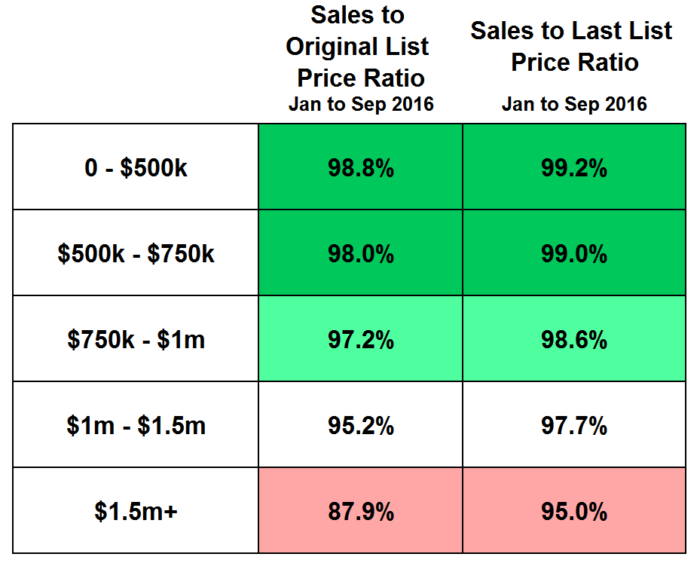
• There were 3,147 closed sales in May, an 18% increase over April 2017 and a 4% increase over May 2016. The sales to list price ratio was 97.8% for all of Orange County. Foreclosures accounted for just 1.1% of all closed sales and short sales accounted for 1.7%. That means that nearly 97.2% of all sales were good ol’ fashioned equity sellers.

Have a safe Holiday!

Sincerely,
Roy A. Hernandez
TNG Real Estate Consulants
Cell 949.922.3947

[gravityform id=”22″ title=”true” description=”true”]

Filed Under: Roy's Blog

OC Housing Report: Applying the Brakes

May 23, 2017 By Roy Hernandez Leave a Comment

Hello!

As housing transitions into the Summer Market, there are more
For Sale signs while demand softens.

The Summer Shift: The annual tradition is no different in 2017, housing is shifting from the Spring Market to the Summer Market. It is the season for commencement speeches, diplomas, and caps thrown into the air to mark the end of a chapter and the beginning of something new. Similarly, this is the season where the robust, hot Spring Market comes to an end, making way for a different market, a new chapter in local real estate, the Summer Market.

While the Summer Market may be the second busiest time of the year for real estate, sellers, buyers, and real estate professionals feel a palpable shift. The active listing inventory slowly and methodically grows from now through mid-August. At the same time, demand softens slightly from the peak of 2017, which occurred two weeks ago.

Many mistakenly think that right now is the absolute best time to come on the market. It is just not true. The best conditions actually occurred at the start of April when the expected market time hit a low. Since then, the expected market time has been slowly rising and will continue to rise from now through the 2017 peak in the active inventory, which typically occurs around mid-August.

Photo/Article courtesy of Steven Thomas.

This shift occurs because summer is full of distractions. From the beach, to the pool, to vacations, buyers’ attention is diverted a bit. Not to mention, the number one distraction, everybody’s kids are on summer break too. It’s just not as easy to see homes when the kids are not confined to their school classrooms.

Even though it will continue to be a seller’s market, overall housing is just about to move from a hot seller’s market to just a seller’s market. The stark difference in this market can be isolated to a bit less activity with not as many offers generated. This shift is much more dramatic in the higher price ranges, from $750,000 and up.

It may be a seller’s market, but sellers really need to approach pricing with extreme caution and care. For sellers who aggressively stretch their asking prices, they risk not being successful and missing both the Spring and Summer Markets. Arbitrarily picking a desired sales price and ignoring the closed and pending sales data is a recipe for disaster and a waste of valuable market time.

For example, a home that sold in December 2016 at $800,000 is not worth $900,000 today, over 12% higher. The market has been appreciating at about 5% annually. That means it takes 365 days for a home to appreciate 5%, not 3 months, not 6 months, not 9 months. It takes a year. On average in Orange County, that $800,000 home would be worth about $820,000, 6-months later. That is 2.5% more.

Additionally, it is worth mentioning that this simple example does not work for every property in every neighborhood. The appreciation rate varies from area to area, neighborhood to neighborhood, and sometimes from street to street. A professional REALTOR® can help dissect the recent closed and pending sales data to help establish the best price for success. Sellers absolutely should NOT utilize Zillow to price a home. Zillow admits it themselves, stating, “The Zestimate® is a starting point in determining a homes’ value and is not an official appraisal.” It is just an approximation and leads to inaccurate pricing. Nothing beats carefully looking at the comparable sales data and comparing the property size, bedrooms, bathrooms, location, amenities, upgrades, condition, lot size, and every other nuance that goes into the sale of a home.

The bottom line is this: the market is slowly cooling right now and the window of opportunity to find success prior to the kids going back to school at the end of August is beginning to close. Sellers find success through accurate pricing. Price out of bounds and risk losing valuable market time during the best time of the year to sell, the Spring and Summer Markets.

Active Inventory: The active inventory increased by 4% in the past couple of weeks.
The active listing inventory added an additional 236 homes in the past two-weeks, a 4% increase, and now sits at 5,623. Expect the inventory to continue to rise until it peaks around mid-August. Even though demand peaks in April to early-May, more homeowners come on the market in the month of June than any other time of the year. Since demand is not as strong, the active inventory grows. As more homes accumulate on the market, there is more seller competition.

Last year at this time, there were 6,267 homes on the market, 11% more than today.

Photo/Article courtesy of Steven Thomas.

Demand: Demand dropped by 3% in the past couple of weeks.Demand, the number of homes placed into escrow within the prior month, dropped by 98 pending sales in the past month, or 3%, and now totals 2,914. In both 2015 and 2016, demand eclipsed the 3,000 mark for two months, compared to just two-weeks this year. A major contributing factor to this year’s phenomenon is the lack of homes coming on the market in the lower ranges. In the last 30 days, there have been 21% fewer homes placed on the market below $500,000, and 11% fewer from $500,000 to $750,000.

We can expect demand to drop slightly from now through the upcoming summer months.

Last year at this time, there were 230 more pending sales totaling 3,144. Current demand is off by 7% compared to last year. The expected market time increased from 53 to 58 days in the past couple of weeks. Last year it was at 60 days, very similar to today.

Luxury End: Luxury demand dropped by 7% in the past couple of weeks while the inventory grew by 4%.
In the past two weeks, demand for homes above $1.25 million decreased from 398 to 369 pending sales, a 4% drop. The luxury home inventory increased from 1,887 homes to 1,965, up 4%. Similar to the rest of the market, demand is dropping for luxury homes while the luxury inventory continues to grow. There is already plenty of seller competition in the upper ranges.

For homes priced between $1.25 million and $1.5 million, the expected market time increased from 89 to 90 days. For homes priced between $1.5 million to $2 million, the expected market time increased from 134 to 162 days. In addition, for homes priced above $2 million, the expected market time increased from 198 days to 235 days. At 235 days, a seller would be looking at placing their home into escrow around mid-January of next year.

Photo/Article courtesy of Steven Thomas.


Orange County Housing Market Summary:

  1.  The active listing inventory increased by 236 homes, or 4%, in the past couple of weeks, and now totals 5,623. Last year, there were 6,267 homes on the market, 644 more than today.There are 35% fewer homes on the market below $500,000 today compared to last year at this time and demand is down by 26%. Fewer and fewer homes and condominiums are now priced below $500,000. This price range is slowly disappearing.
  2.  Demand, the number of pending sales over the prior month, dropped by 3% in the past couple of weeks, shedding 98 pending sales and now totals 2,914 , dropping below 3,000 a bit earlier than the past couple of years. The average pending price is $859,899.
  3. The average list price for all of Orange County remained at $1.6 million. This number is high due to the mix of homes in the luxury ranges that sit on the market and do not move as quickly as the lower end.
  4. For homes priced below $750,000, the market is HOT with an expected market time of just 37 days. This range represents 38% of the active inventory and 60% of demand.
  5. For homes priced between $750,000 and $1 million, the expected market time is 55 days, a hot seller’s market (less than 60 days). This range represents 19% of the active inventory and 20% of demand.
  6. For homes priced between $1 million to $1.25 million, the expected market time is at 65 days, a seller’s market.
  7. For luxury homes priced between $1.25 million and $1.5 million, the expected market time increased from 89 to 90 days. For homes priced between $1.5 million to $2 million, the expected market time increased from 134 to 162 days. For luxury homes priced above $2 million, the expected market time increased from 198 to 235 days.
  8. The luxury end, all homes above $1.25 million, accounts for 35% of the inventory and only 12% of demand.
  9.  The expected market time for all homes in Orange County increased from 54 days to 58 in the past couple of weeks, a solid seller’s market (less than 60 days), but about to transition into a normal seller’s market (60 to 90 days). From here, we can expect the market time to slowly rise throughout the Spring and Summer Markets, moving from a deep seller’s market to a slight seller’s market.
  10. Distressed homes, both short sales and foreclosures combined, make up only 1.2% of all listings and 2.5% of demand. There are only 31 foreclosures and 37 short sales available to purchase today in all of Orange County, that’s 68 total distressed homes on the active market, 13 fewer than two weeks ago. Last year there were 141 total distressed sales, 107% more; that’s more than double.
  11. There were 2,663 closed sales in April, a 5% decrease over March 2017 and a 3% decreased over April 2016. The sales to list price ratio was 98.6% for all of Orange County. Foreclosures accounted for just 0.8% of all closed sales and short sales accounted for 1.4%. That means that nearly 98% of all sales were good ol’ fashioned equity sellers

Have a great week.

Roy A, Hernandez
TNG Real Estate Consultants
949.922.3947
RoyaltyAgent@Gmail.com

Photos and article courtesy of Steven Thomas.

[gravityform id=”22″ title=”true” description=”true”]

Filed Under: Roy's Blog

The Top Dates for Listing a Home Revealed

February 20, 2017 By Roy Hernandez Leave a Comment

Home listings are most likely to debut on Thursdays and Fridays, with Fridays being the most common listing day by a slight margin, according to research by the National Association of REALTORS®.

What are the most popular dates to list? Half of all new listings in 2016 were first listed between March and July, which supports that the spring season is indeed real estate’s busiest time.

The most popular month for new listings is April, followed by March, May, June, and July, according to NAR.

“While home closings exhibit a strong tendency to get done at the end of the month, listings are much steadier throughout the course of the month with a slight tendency to be posted earlier rather than later,” NAR researchers note at the Economists’ Outlook blog.

[gravityform id=”22″ title=”true” description=”true”]

Filed Under: Roy's Blog

4 Concrete Reasons to Remodel Your Home in 2017

February 4, 2017 By Roy Hernandez Leave a Comment


You know how you’ve always wanted to expand your family room to make it more open? Or how you’ve been dying to add an extra bathroom that you can have all to yourself? Well, our magic eight ball says the outlook is good for your home upgrade dreams: 2017 is a great time to finally take the plunge and renovate or remodel.

Why? Well, according to home improvement experts, your renovation will cost less today than if you were to wait until next year—for a variety of reasons.

“Concrete doesn’t double in a month, but costs do continually tick up,” says Dan Bawden, chairman of the National Association of Home Builders Remodelers and owner and CEO of Legal Eagle Contractors in Houston.

Bawden says renovating will never get cheaper than it is now.

If you’re a glass-half-empty kind of person, that news might bum you out. But we take it to mean 2017 is the most cost-efficient time to renovate. Do it soon—here’s why.

(For a chance to win $20,000 to spend on the home of your dreams, enter the realtor.com® Entryway to $20K sweepstakes at realtor.com/entryway20k. No purchase necessary. See official rules.)

Reason No. 1: Consumer confidence is improving

As job growth increases and wages improve, people generally feel good about the economy and their future. That makes them also feel good about investing in home improvements.

“Remodeling decisions are made by families based upon their consumer confidence,” Bawden says.

And that confidence, for now, is increasing. In December 2016, the Consumer Confidence Index posted another gain and reached 113.7—a virtually giddy number compared to when the index tanked to its all-time low of 37.7 in January 2009, the height of the Great Recession.

Bawden calls today’s confidence levels a “rising tide of optimism.”

“Last year we had a record year in my company, and I think 2017 is going to be a great year,” he says.

Reason No. 2: Contractor and construction worker availability is decreasing

Now we know 2017 is shaping up to be a busier year for contractors. That’s good news for the economy! But the bad news is this: The busier those contractors get, the longer you might have to wait to begin a remodeling project. Bawden says he already has a six-week wait period to begin new jobs, which is partly due to a dearth of skilled tradesmen available for hire.

And there’s a double whammy: There’s also a national shortage of construction workers—and these workers are not getting any younger.

“The average guy working for me is 55,” Bawden says. “It’s hard to find new people who are good.”

So if you’re hoping to squeeze in a home remodel or renovation, it’s better to do it now, before you’re relegated to the back of a very long line.

Reason No. 3: Financing is still affordable

Although some people might be sitting on piles of cash they can use for a remodel (we’re not jealous or anything), many rely on financing—often by borrowing against the equity in their homes. And these days, it’s a great time to take out a home equity loan or line of credit because home prices are rising and loan rates are still low.

But loan rates are certainly on the rise. At the end of November the interest on home equity loans stood at 4.82%. By the end of December, the rate was 4.97%. And in mid-January of this year, we’re looking at an interest rate of 5.21%.

Still, keep this mind: Even though borrowing costs are rising, so are home values. Lower inventory and mounting demand have bolstered home prices. The median existing-home price in November 2016 was $234,900, up 6.8% from November 2015, according to NAR research.

As the value of your home increases, so does your equity. And it’s primarily the equity in your home—the difference between the fair market value of your home and what you owe—that supports a loan you can use to add that bathroom or replace the roof.

“Having more equity opens up more opportunity,” says Jonathan Smoke, chief economist of realtor.com®. “Since interest rates are low and equity is up, now would be a great time to look into applying for a home equity loan.”

Reason No. 4: Material costs will increase

No matter how low U.S. inflation might be, prices for building materials manufactured around the globe always seem to go up. Even though inflation may be low here, it could be rising in Italy, where the bathroom tile you love is manufactured. Or tariff pressures might make that slab of granite from Brazil more expensive.

The result is that building costs, labor, and insurance, always rise—perhaps not quickly, but inevitably. And wouldn’t you rather remodel when it’s cheaper?

“If you (renovate) a house two years from now, it will be more expensive,” Bawden says. “Prices are always going up.”

[gravityform id=”22″ title=”true” description=”true”]

Filed Under: Roy's Blog

HUD suspends FHA mortgage insurance rate cut

January 21, 2017 By Roy Hernandez Leave a Comment

An hour after Donald Trump assumed the presidency Friday, his administration indefinitely suspended a pending rate cut for mortgage insurance required for FHA-backed loans, which are popular with first-time home buyers and those with poor credit.

The move by the Department of Housing and Urban Development — one of the first acts of Trump’s administration — reversed a policy announced in the waning days of the Obama presidency that would have trimmed insurance premiums for typical borrowers by hundreds of dollars a year.

Some Republicans expressed concern that the rate cut could cost taxpayers if the loans started to go sour and the Federal Housing Administration was unable to cover the losses. The agency needed a $1.7-billion bailout from the U.S. Treasury in 2013 after it expanded its role last decade after the collapse of the subprime mortgage market.

The FHA does not issue loans, but instead insures mortgages and collects fees from borrowers to reimburse lenders in case of default. Borrowers can qualify for an FHA-backed mortgage, with down payments as small as 3.5%, even with a credit score as low as 580, which could signal a past bankruptcy or debts sent to collection.

The average credit score of an FHA borrower in the third quarter of last year was 679, a credit worthiness considered to be fair.

FHA-backed loans have seen robust growth in recent years and lenders not chartered as banks now control a majority of the riskier FHA market. The shift toward nonbank lenders also has drawn concerns because banks have strict reserve requirements while the crop of new lenders operates under a variety of business models.

Last week, during a confirmation hearing for Trump’s nominee for HUD secretary, Ben Carson, Sen. Pat Toomey (R-Pa.) argued that private mortgage insurance should play a larger role in the market for homes acquired by buyers who can’t afford traditional 20% down payments.

Carson appeared open to such a possibility and told Toomey it didn’t matter what entity provided insurance, but “we do have to have a mechanism, backstop.”

Carson also said he was surprised by the recent FHA rate cut and promised that if confirmed he would work with the “FHA administrator and other financial experts to really examine that policy.”

The suspension of the rate cut, set to take effect Jan. 27, came before his confirmation vote.

In a letter announcing the suspension Friday morning, HUD, which oversees the FHA, said more analysis is needed on any “future adjustments” to insurance premium rates. For most borrowers, the rate will now remain at 0.85%, rather than 0.60%.

“FHA is committed to ensuring its mortgage insurance programs remains viable and effective in the long term for all parties involved, especially our taxpayers,” the letter to the real estate industry said.

In cutting the insurance premium, the Obama administration had argued that the FHA’s finances had vastly improved since it received its first-ever bailout in 2013 to cover potential losses on the huge volume of low-down-payment mortgages it insured from 2007 to 2009 after the housing bust.

The administration noted that the agency’s Mutual Mortgage Insurance Fund’s capital reserve ratio exceeded requirements for the second year in a row.

“With sufficient reserves on hand to meet future claims, it’s time for FHA to pass along some modest savings to working families,” former HUD Secretary Julian Castro said in announcing the cut.

The suspension of that decision will be a disappointment to home buyers currently out shopping, especially on top of the rise in mortgage interest rates following the November election.

In Los Angeles and Orange counties, the limit on an FHA mortgage is $636,150.

If the planned reductions went into effect, borrowers who put down less than 5% on a $600,000, 30-year mortgage would have saved $1,500 a year. The Obama administration estimated that new FHA borrowers across the nation would have saved an average of $500 a year.

“That is real money,” Southern California mortgage broker Jeff Lazerson said.

Lazerson, president of Mortgage Grader in Laguna Niguel, said he had several clients who were putting off deals so they could get a cheaper insurance rate after Jan. 27.

“We got lots of calls,” he said.

In its letter announcing the suspension of the rate cut, HUD did not give a timeline for any coming decision and said the suspension was indefinite.

The California Assn. of Realtors called for the Trump administration to quickly review the rate reduction, noting it would have saved FHA-backed borrowers in California an average of $860 a year.

“FHA’s single-family home portfolio is financially sound as it has ever been, and we hope that once the new administration has thoroughly reviewed the merits of the premium reduction the suspension will immediately be lifted,” the association’s president, Geoff McIntosh, said in a statement.

[gravityform id=”22″ title=”true” description=”true”]


Filed Under: Roy's Blog

Mortgage rates highest in two years

December 8, 2016 By Roy Hernandez Leave a Comment

mortgage-rates-riseMortgage rates increased for the sixth week in a row to highs not seen in more than two years.

According to the latest data released Thursday by Freddie Mac, the 30-year fixed-rate average climbed to 4.13 percent with an average 0.5 point. (Points are fees paid to a lender equal to 1 percent of the loan amount.) It was 4.08 percent a week ago and 3.95 percent a year ago. The 30-year fixed rate hasn’t been this high since October 2014. It has climbed 66 basis points in six weeks. (A basis point is 0.01 percentage point.)

The 15-year fixed-rate average edged up to 3.36 percent with an average 0.5 point. It was 3.34 percent a week ago and 3.19 percent a year ago. The five-year adjustable rate average crept up to 3.17 percent with an average 0.5 point. It was 3.15 percent a week ago and 3.03 percent a year ago.

“The 10-year Treasury yield dipped this week following the release of the Job Openings and Labor Turnover Survey,” Sean Becketti, Freddie Mac chief economist, said in a statement. “As rates continue to climb and the year comes to a close, next week’s [Federal Reserve] meeting will be the talk of the town with the markets 94 percent certain of a quarter-point-rate hike.”

The rapid rise in mortgage rates is due in part to rising long-term bond yields. The 10-year Treasury is one of best indicators of where rates are headed. When yields go up, rates go up.

Although long-term bond yields have retreated a bit this week, they remain significantly higher than they were a month ago.

In an interview with CNBC on Monday, New York federal bank president William Dudley, who along with his colleagues will decide next week whether to raise the Federal Reserve’s benchmark rate, spoke about what’s driving the markets.

“What we’ve seen post-election is we’ve seen bond yields up, equity market up, dollar firmer,” he said. “My judgment is that it seems to be that what people are factoring in is [the] likelihood of more fiscal stimulus and reduced downside risk to the economy.”

Dudley went on to say that the bond market also is experiencing a bit of a “correction.”

[gravityform id=”22″ title=”true” description=”true”]

Filed Under: Roy's Blog

The 9 Most Enchanting, Magical Christmas Towns In Southern California

November 28, 2016 By Roy Hernandez

There’s nothing more enchanting than the magic of the Christmas season. One of the best ways to get into the spirit of the holiday is to head to a town that captures all the beauty of Christmas. These nine towns in Southern California will surround you with twinkling light displays, Christmas caroling, towering trees decorated in holiday splendor, and festive eats and drinks that will remind you why this is your favorite time of year.

1. Downtown Riverside
flickr/don graham
The Mission Inn Festival of Lights brings a magical Christmas spirit to downtown Riverside. Carriage rides and twinkly lights galore will get you into the spirit in no time.
2. Solvang
2. Solvang
flickr/solvang usa
Nothing says Christmas like the town of Solvang. A holiday stroll through this European village will make you believe in the magic of Christmas. Take a holiday trolley ride through town or walk through the village and visit the quaint shops and restaurants that are all dolled up for the holidays.
3. Anaheim
3. Anaheim
flickr/goeff dude
Spending a day at Disneyland during the holiday season is like going to the most spectacular Christmas town you could possibly imagine. Festive parades, Santa on his sleigh, and fresh Christmas snow dropping from the sky will make you believe that holiday magic really exists.
4. Wrightwood
4. Wrightwood
flickr/charlie essers
The small town of Wrightwood feels like Christmas all year-round. But during December things get really festive, especially when there’s snow on the ground. Spend a day exploring the shops at this quaint village then end your day at the Evergreen Cafe’ where the holidays come to life with colorful ornaments and a holiday display ready to greet you.
5. Coronado
5. Coronado
flickr/david verdugo
Coronado is magical at Christmas, especially at the Hotel Del. Take a day trip to see the towering Christmas tree in the lobby and then do a little ice skating at the outdoor rink as you sip on a cup of hot cocoa. It’s pure Christmas bliss!
6. Temecula
6. Temecula
yelp/mark l.
Beginning on December 1st, Temecula transforms into a winter wonderland during the annual Winterfest celebration that runs through the end of February. You’ll be dazzled by magnificent holiday displays, a festive outdoor ice skating rink inside the town square of Old Town, and tons of festive shops to buy all your holiday presents.
7. Altadena
7. Altadena
flickr/karol franks
Altadena is home to some of the most delightful Christmas experiences you can find in Southern California. Until you drive through historic Christmas Tree Lane to see the spectacular holiday lights draped along the deodar cedar trees, or stroll down Mendocino Lane to experience the magnificence of the historic Balian House all aglow in thousands of holiday lights, your Christmas won’t be complete. Pictured here: Balian House located at 1960 Mendocino Lane.
8. Redlands
8. Redlands
flickr/cyclotourist
The charming town of Redlands sure knows how to capture the magic of Christmas. A memorable way to join the town festivities is at its annual Christmas parade on Saturday, December 3rd at 6pm along State Street and Citrus Avenue.
9. Big Bear Lake
9. Big Bear Lake
facebook/big bear lake
There’s nothing more Christmasy than a flurry of white snow all around you. Big Bear Lake is a wonderful destination when you want to get out of the SoCal sun and experience a white Christmas.

Anyone who says Christmas isn’t magical in Southern California hasn’t had the pleasure of visiting these charming towns. For more holiday splendor, take a ride on the Magic Polar Express Train in SoCal.

Filed Under: Roy's Blog

How To Prepare Your House For Sale

November 18, 2016 By Roy Hernandez Leave a Comment

budget-friendly-ways-to-prep-a-home-for-sale    Prepping and staging a house. Every seller wants her home to sell fast and bring top dollar. Does that sound good to you? Well, it’s not luck that makes that happen. It’s careful planning and knowing how to professionally spruce up your home that will send home buyers scurrying for their checkbooks. Here is how to prep a house and turn it into an irresistible and marketable home.

Here’s How:

  1. Disassociate Yourself With Your Home.
    • Say to yourself, “This is not my home; it is a house — a product to be sold much like a box of cereal on the grocery store shelf.
    • Make the mental decision to “let go” of your emotions and focus on the fact that soon this house will no longer be yours.
    • Picture yourself handing over the keys and envelopes containing appliance warranties to the new owners!
    • Say goodbye to every room.
    • Don’t look backwards — look toward the future.


  2. De-Personalize.
    Pack up those personal photographs and family heirlooms. Buyers can’t see past personal artifacts, and you don’t want them to be distracted. You want buyers to imagine their own photos on the walls, and they can’t do that if yours are there! You don’t want to make any buyer ask, “I wonder what kind of people live in this home?” You want buyers to say, “I can see myself living here.”
  3. De-Clutter!
    People collect an amazing quantity of junk. Consider this: if you haven’t used it in over a year, you probably don’t need it.

    • If you don’t need it, why not donate it or throw it away?
    • Remove all books from bookcases.
    • Pack up those knickknacks.
    • Clean off everything on kitchen counters.
    • Put essential items used daily in a small box that can be stored in a closet when not in use.
    • Think of this process as a head-start on the packing you will eventually need to do anyway.


  4. Rearrange Bedroom Closets and Kitchen Cabinets.
    Buyers love to snoop and will open closet and cabinet doors. Think of the message it sends if items fall out! Now imagine what a buyer believes about you if she sees everything organized. It says you probably take good care of the rest of the house as well. This means:

    • Alphabetize spice jars.
    • Neatly stack dishes.
    • Turn coffee cup handles facing the same way.
    • Hang shirts together, buttoned and facing the same direction.
    • Line up shoes.

  5. Rent a Storage Unit.
    Almost every home shows better with less furniture. Remove pieces of furniture that block or hamper paths and walkways and put them in storage. Since your bookcases are now empty, store them. Remove extra leaves from your dining room table to make the room appear larger. Leave just enough furniture in each room to showcase the room’s purpose and plenty of room to move around. You don’t want buyers scratching their heads and saying, “What is this room used for?”
  6. Remove/Replace Favorite Items.
    If you want to take window coverings, built-in appliances or fixtures with you, remove them now. If the chandelier in the dining room once belonged to your great grandmother, take it down. If a buyer never sees it, she won’t want it. Once you tell a buyer she can’t have an item, she will covet it, and it could blow your deal. Pack those items and replace them, if necessary.
  7. Make Minor Repairs.
    • Replace cracked floor or counter tiles.
    • Patch holes in walls.
    • Fix leaky faucets.
    • Fix doors that don’t close properly and kitchen drawers that jam.
    • Consider painting your walls neutral colors, especially if you have grown accustomed to purple or pink walls.
      (Don’t give buyers any reason to remember your home as “the house with the orange bathroom.”)
    • Replace burned-out light bulbs.
    • If you’ve considered replacing a worn bedspread, do so now!


  8. Make the House Sparkle!
    • Wash windows inside and out.
    • Rent a pressure washer and spray down sidewalks and exterior.
    • Clean out cobwebs.
    • Re-caulk tubs, showers and sinks.
    • Polish chrome faucets and mirrors.
    • Clean out the refrigerator.
    • Vacuum daily.
    • Wax floors.
    • Dust furniture, ceiling fan blades and light fixtures.
    • Bleach dingy grout.
    • Replace worn rugs.
    • Hang up fresh towels.
    • Bathroom towels look great fastened with ribbon and bows.
    • Clean and air out any musty smelling areas. Odors are a no-no.


  9. Scrutinize.
    • Go outside and open your front door. Stand there. Do you want to go inside? Does the house welcome you?
    • Linger in the doorway of every single room and imagine how your house will look to a buyer.
    • Examine carefully how furniture is arranged and move pieces around until it makes sense.
    • Make sure window coverings hang level.
    • Tune in to the room’s statement and its emotional pull. Does it have impact and pizzazz?
    • Does it look like nobody lives in this house? You’re almost finished.


         10.    Check Curb Appeal.
If a buyer won’t get out of her agent’s car because she doesn’t like the exterior of your home, you’ll never get her inside.

  • Keep the sidewalks cleared.
  • Mow the lawn.
  • Paint faded window trim.
  • Plant yellow flowers or group flower pots together. Yellow evokes a buying emotion. Marigolds are inexpensive.
  • Trim your bushes.
  • Make sure visitors can clearly read your house number.


beforeafter

Staging your home for TOP DOLLAR.

In any market, it’s critical to stage your house to when you are getting ready to sell. Regardless of the interest rate on home loans, the price of homes in your neighborhood, or the number of homes on the market, you will always get better results when you stage your house specifically to get it sold. Of course, we all have a visual image of what it looks like to stage a house – and it is usually a model home, or something you remember seeing in Architectural Digest or Downton Abbey, or one of the houses of “The Real Housewives of Orange County.’’

Let’s get down to the top two staging priorities for hopeful homesellers in today’s Orange County market.

  1. Clean and tidy – the foundation of a successful sale

Clean, dust, polish, vacuum, rake, sweep, power wash, mow and blow – use any or all of these techniques to make your home crystal clean. Now it’s time to tidy up. Put away everything. Pack up the legos, books, crafts, greeting cards, collections, hobbies, bills, magazines, bowls, canisters, dog toys – look around your house and complete the list. Take it down to the bare bones and make sure everything is sparkling clean and all your stuff is stored away. Even if it fills up your garage.

  1. Emotional appeal – The lure to bring in buyers begging for your house

Color schemes are great place to start staging. Pick a simple palette for each room or vignette. If you have dish cloths, canisters, napkins, dishes and glasses in all colors of the rainbow, pick two complimentary colors for your kitchen display and box the rest up – you are moving, remember? It doesn’t matter if the pieces you choose were in the extreme markdown bin or from the last neighborhood garage sale. If they look good together, are clean and well organized, you’ll get that “wow” factor – paying attention to detail showed that buyer how beautiful your house can be.

Display only two or three items on your countertops. Just saying “displaying items” should put you in the mindset that you are staging your home for a specific purpose – to entice a qualified buyer to make an offer!  That applies to all counters – kitchen, bathrooms (yep, all of them), laundry room. It even extends to the tops of buffets, sideboards, couch tables, dressers, bedside tables, and bookshelves. You should set all dining tables with matching plates and coordinating glasses. When selecting items to display, your toaster oven with the aluminum foil wrapped around the insert-able tray should not be one of them.

Look at each and every room with a new vision. Is your kitchen beckoning prospective homebuyers to come on in and start dinner?  Better yet, does it look like dinner is ready to be put on the table?  Does your living room look like the lobby of a five-star hotel or the sitting room of a penthouse suite? Does your master bedroom look like the butler just plumped your pillows and turned down your covers, and is there a designer chocolate on the pillow?

Does it look so inviting that you worry about coming home to find someone may actually be under the covers?  If you can say yes to most of these questions, you’re on the right track.  If your home is priced right, expect an offer to come in quickly!

[gravityform id=”22″ title=”true” description=”true”]


Filed Under: Roy's Blog

OC Housing Report: Surge of Homes Off Market

October 17, 2016 By Roy Hernandez Leave a Comment

time-expiredThe 2016 Orange County housing market has been incredibly hot, yet there are plenty of unsuccessful sellers.

Unsuccessful Sellers: There are 7% more homes pulled off the market this year compared to 2015.
The housing market has been HOT this year. As a matter of fact, current demand is up 13% year over year. The inventory has been way below the long term average, homes have flown off the market, multiple offers are still the norm, and homes are fetching values very close to their asking prices. Yet, through September, there were still 7,577 sellers who were not successful and pulled their homes off the market, 7% more than last year.

What gives? If the market is blazing hot, why in the world wouldn’t every seller be successful? There are many reasons why homes don’t sell, even in an environment where supply is low and demand is high; but, the number one reason boils down to over exuberant sellers. Buyers are just not that willing to stretch too far above the most recent comparable sale.

off-market-yoyThis is not just a luxury market phenomenon. 48% of all homes pulled off the market could be found below $750,000, and 66% were below $1 million. There were plenty of unsuccessful sellers in the hottest ranges. Even the sizzling hot price range below $500,000, where the expected market time has been less than 2 months all year long, experienced a lack of success. 1,667 sellers pulled their homes off the market in this range, or 22% of all unsuccessful sellers.

Price is the biggest bellwether in successfully selling a home. Many homeowners come on the market feeling that their home is the absolute best in the neighborhood, and, therefore, should fetch the highest sales price, more than the most recent comparable sale. This leads to stretching the price too high and pushes away buyers from writing an offer.

A brilliant strategy is to price a home very close to the most recent comparable or pending sale. Typically, this approach results in multiple offers. Multiple offers can be leveraged to procure negotiated prices above the asking price. Another strategy is to offer a little less than the last comparable or pending sale, leading to even more offers to purchase. This approach quickly can turn into a bidding war for a home and often results in negotiated prices way above the asking price.

Instead, most sellers initially opt to overprice their home. In tracking the sales to list price ratio, sellers are fetching values very close to their asking prices. But, if you look at the Sales to the Original List Price Ratio and compare it to the Sales to Last List Price Ratio, the higher the price, the more a home had to reduce the price in order to find success. For example, a home originally priced at $850,000, on average, had to reduce the price to $838,000, ultimately selling for $826,000.

sales-price-ratio

Sellers take a look at the most recent comparable pending and closed sales and then justify a higher asking price for their home. They want a little extra cushion for negotiations. They also feel their home is the best in the neighborhood and will bring them a record price. Both result in overpricing and prevent a home from obtaining any offers. Consequently, they will have to reduce the asking price to be in alignment with the Fair Market Value; or, ultimately, they will have to pull their home off the market.

Pricing is essential and homeowners need to lean on the expertise of a professional, their REALTOR®, or they risk wasting their time and energy in preparing and exposing their home to the market for a lengthy period of time.

Luxury End: Luxury demand increased by 9% in the past month.
In the past month, demand for homes above $1 million increased from 417 to 456 pending sales, a 9% increase. During that same time, the luxury home inventory dropped from 2,574 homes to 2,402, a 7% drop. With an increase in demand and a falling inventory, the expected market time dropped from 175 days to 158 days for homes priced above $1 million.

For homes priced between $1 million to $1.5 million, the expected market time decreased from 122 days to 113 in the past two weeks. For homes priced between $1.5 million to $2 million, the expected market time decreases from 168 days to 165 days. For homes priced above $2 million, the expected market time dropped significantly from 306 days to 245 days. It was at 385 days just one month ago. Still, at 245 days, a seller is looking at placing their home in escrow in mid-June 2017.

From $1 million to $2 million, demand (the number of pending sales over the prior month) is up by 18%, 327 pending sales today compared to 276 last year. The inventory is up by 12%, 357 homes compared to 318 in 2015. For luxury homes above $2 million, demand is up by 8%, 103 pending sales compared to 95, a difference of 8. The inventory is up 17%, 1,049 homes today compared to 894 last year, a difference of 155. Even though demand is up a few pending sales, there are a lot more luxury homes on the market competing against each other.

Active Inventory: The active inventory shed 314 in just two weeks, a 5% drop.
In the past couple of weeks, the active inventory dropped by 314 homes, the largest drop so far this year. The 5% drop resulted in reaching levels not seen since mid-May and now totals 6,472. In the past month, the inventory has plunged by 568 homes, or 8%. A drop in the inventory is typical for the Autumn Market, but a 568 home drop in a month is the largest for this time of the year since 2008 when it declined from 13,582 homes to 12,940, or 5%. Keep in mind, there were a lot more homes on the market back then.

Expect the inventory will continue to drop for the remainder of the year. Last year there were 257 more homes on the market, an additional 4%, totaling 6,729.

Demand: The market is surging with demand up 13% year over year.
Demand, the number of new pending sales over the prior month, decreased from 2,812 to 2,693, a drop of 119, or 4%. Yet, it is the hottest start to October since 2012. That market was completely different with foreclosures and short sales accounting for 31% of all sales compared to just 3% today.

Demand is considerably stronger than last year at this time, up 13% year over year. There were 315 fewer pending sales last year, totaling 2,378.

With a drop in both demand and the active inventory, the expected market time remained the same at 72 days.
demand-yoy

Orange County Housing Market Summary:

• The active listing inventory dramatically dropped in the past couple of weeks, shedding 314 homes, or 5%, and now totals 6,472, the lowest level since mid-May. The inventory will continue to drop through the end of the year.

• There are 21% fewer homes on the market below $500,000 compared to last year at this time and demand is identical to last year. The trend of a disappearing lower range continues with fewer and fewer homes available as home prices continue to rise.

• Demand, the number of pending sales over the prior month, decreased by 4% from 2,812 to 2,693 in the past two weeks. Yet, it is the strongest start to October since 2012. Demand was at 2,378 pending sales last year. Today’s demand is a staggering 13% more than last year. The average pending price is $823,442.

• The average list price for all of Orange County is $1.5 million.

• For homes priced below $750,000, the market is HOT with an expected market time of just 49 days. This range represents 45% of the active inventory and 66% of demand.

• For homes priced between $750,000 and $1 million, the expected market time is 77 days, a slight seller’s market (between 60 and 90 days). This range represents 18% of the active inventory and 17% of demand.

• For luxury homes priced between $1 million to $1.5 million, the expected market time is at 113 days, decreasing by 9 days in the past couple of weeks. For homes priced between $1.5 million to $2 million, the expected market time decreased from 168 days to 165 days. For luxury homes priced above $2 million, the expected market time dropped considerably from 306 days to 245 days.

• The luxury end, all homes above $1 million, accounts for 37% of the inventory and only 17% of demand.

• The expected market time for all homes in Orange County remained the same in the past couple of weeks, 72 days, a slight seller’s market (between 60 and 90 days).

• Distressed homes, both short sales and foreclosures combined, make up only 2% of all listings and 2.7% of demand. There are 38 foreclosures and 90 short sales available to purchase today in all of Orange County, that’s 128 total distressed homes on the active market, increasing by 8 in the past two weeks. Last year there were 185 total distressed sales, 45% more.

• There were 2,745 closed sales in September, a 10% drop from July and up 2% compared to September 2015’s total of 2,680 closings. The sales to list price ratio was 97.9%. Foreclosures accounted for 1.3% of all closed sales and short sales accounted for 1.9%. That means that 96.8% of all sales were good ol’ fashioned equity sellers.

Have a great week.

Sincerely,
Roy Hernandez
TNG Real Estate Consultants
Cell 949.922.3947

[gravityform id=”22″ title=”true” description=”true”]

Filed Under: Roy's Blog

OC Housing Report: It’s called AUTUMN

August 31, 2016 By Roy Hernandez Leave a Comment

Autumn picHousing is shifting gears quickly now that the kids are back in school.

Housing in Autumn: The Orange County housing market is quickly evolving as it enters the Autumn season.
In the coming weeks, many who are involved in the real estate market will exclaim, “The housing markets is slowing! Homes are starting to sit on the market longer! There are not as many showings! What’s going on?!?” It’s actually a cyclical phenomenon. We experience it every year. It’s called AUTUMN.

Here’s what happens; every year the kids go back to school and the market changes. Yes, homes take a little longer to sell. Yes, there are fewer showings. There are also fewer sellers coming on the market. Many sellers who were unsuccessful during the Spring and Summer Markets will decide to throw in the towel and pull their homes off of the market completely. Collectively, with both fewer sellers coming on the market and many sellers throwing in the towel, the active listing inventory drops for the remainder of the year, until it reaches a low on New Year’s Day.

Last year, from the end of August through the end of the year, the active listing inventory dropped 31%. Homeowners get it: the Spring and Summer markets are officially in the rearview mirror. With the best and second best time of the year to sell now is the past, fewer homeowners pull the trigger and list their homes. As a result, the inventory falls as the year unwinds.

The number of buyers in the marketplace drops as well. Now that the kids are back in school, it is not the most advantageous time of the year to move. Moving is disruptive, which is precisely why more closed sales occur in June, July, and August. It’s much easier to move a family during the summer months when the kids are in transition from one school year to the next.

With fewer homes coming on the market for the remainder of the year, that means there are fewer choices. This too contributes to a drop in demand. As a result, demand drops for the remainder of the year, until it hits a low on New Year’s Day. If you are keeping track, both demand and the listing inventory drop to their lowest levels on New Year’s Day. It’s not just a lack of demand; it’s also a lack of supply.

OC YOY

Some buyers mistakenly think they can get a big “deal” during this time of the year, especially in November and December. The standard logical thinking sounds a bit like this: “If a homeowner has their home on the market during the holidays, they must be desperate.” It’s just not the case. We have been in an appreciating market for years now. Just because it is the holly, jolly season does not mean that sellers are all of a sudden going to become generous and provide a big discount. “Merry Christmas, Happy Hanukkah, Happy Kwanzaa!! Mr. and Mrs. Buyer, go ahead and take 20% off the asking price.” It’s just not going to happen. Sellers simply want every dime they can get for their home, regardless of the time of year.

And, for those buyers that are holding out for a major correction, there is not one on the horizon, not anytime soon. There are still not enough homes on the market and demand is HOT. With interest rates remaining below 4% and not looking to change much in the near future, Orange County will continue to experience a seller’s market.  Janet Yellen, chair of the Federal Reserve, just last week stated that they are most likely going to increase the short term rate in December. In December last year, she foreshadowed that they were looking at increasing the rate four times in 2016; instead, it will only be one little change of a quarter percent and it won’t come until the very end of the year. These low interest rates are fueling the hot demand that we are experiencing today.

Sellers need to be wary of the season as well. This is not the time of the year where buyers are willing to stretch that far beyond the most recent comparable sale. Overprice today and sellers will not find success for the remainder of the year. It’s that simple. It is the season where everybody is a bit more price sensitive. Price according to the most recent comparable pending and closed sales and most homes fly off the market, even during the Autumn and Holiday Markets.

Luxury End: Luxury demand has dropped 4% in the past couple of weeks.

In the past couple of weeks, demand for homes above $1 million dropped from 483 pending sales to 465, a 4% drop. The inventory of luxury homes now totals 2,658. Demand will continue to drop as we push our way into the Autumn Market, but so will the luxury inventory.

For homes priced between $1 million to $1.5 million, the expected market time increased slightly from 114 days to 116 in the past two weeks. For homes priced between $1.5 million to $2 million, the expected market time decreased slightly from 159 days to 152 days. For homes priced above $2 million, the expected market time dramatically increased from 304 days to 357 days, just shy of a complete year.

OC graph

Regardless of how hot the market it in the lower ranges, it behaves differently in the luxury ranges, especially above $1.5 million. Homes do not fly off the market with multiple offers like they do in the lower ranges. Price, patience, and perseverance are essential ingredients in order to find success.

Active Inventory: The inventory has hit a plateau and is poised to start its cyclical drop.
The active inventory peaked early this year, mid-July, at 7,329 homes, but it really has not changed much since. In the past couple of weeks it dropped by only 28 homes, and, since reaching the peak, has only shed 62 homes. Today, the inventory sits at 7,267 homes. Now that the kids have gone back to school, summer is over and fewer homeowners will place their homes on the market; and, many sellers leftover from the Spring and Summer Markets are going to throw in the towel and pull their homes off the market. As a result, the inventory will drop.

Last year there were 89 fewer homes on the market, 1% less, totaling 7,178.

Demand: In the past two-weeks demand dropped by 3%.
Demand, the number of new pending sales over the prior month, dropped by 92 homes, or 3%, and now totals 2,843 pending sales. Demand is still much stronger for this time of the year, levels not seen since prior to the Great Recession. Last year at this time there were 121 fewer pending sales, 4% less than today.

The expected market time increased from 75 days two weeks ago to 77 days today.

Orange County Housing Market Summary:

• Typically, the active inventory peaks in August, but this year it peaked in mid-July and has since dropped by 62 homes, now totaling 7,267. There are 89 more homes on the market compared to last year at this time. The inventory is about to drop as we move into the Autumn Market.
• There are 19% fewer homes on the market below $500,000 compared to last year at this time and demand is down by 10% as well. As home values continue to rise, this range is slowly vanishing.
• Demand, the number of pending sales over the prior month, decreased by 3% from 2,935 to 2,843 in the past two weeks. Demand was at 2,722 last year, 4% less than today. The average pending price is $778,632.

• The average list price for all of Orange County is $1.5 million.

• For homes priced below $750,000, the market is HOT with an expected market time of just 50 days. This range represents 45% of the active inventory and 69% of demand.

• For homes priced between $750,000 and $1 million, the expected market time is 94 days, a balanced market (between 90 and 120 days). A balanced market does not favor sellers or buyers. This range represents 19% of the active inventory and 16% of demand.

• For luxury homes priced between $1 million to $1.5 million, the expected market time is at 116 days, increasing slightly by 2 days in the past couple of weeks. For homes priced between $1.5 million to $2 million, the expected market time dropped slightly from 159 days to 152 days. For luxury homes priced above $2 million, the expected market time increased dramatically from 304 days to 357 days.

• The luxury end, all homes above $1 million, accounts for 37% of the inventory and only 16% of demand.

• The expected market time for all homes in Orange County increased from 75 to 77 days in the past couple of weeks, a slight seller’s market.

• Distressed homes, both short sales and foreclosures combined, make up only 1.9% of all listings and 3% of demand. There are 43 foreclosures and 93 short sales available to purchase today, that’s 136 total distressed homes on the active market, increasing by 6 in the past two weeks. Last year there were 219 total distressed sales.

• There were 2,820 closed sales in July, a 9% drop from June and 13% fewer than last year’s 3,243 closings. The sales to list price ratio was 97.5%. Foreclosures accounted for 1% of all closed sales and short sales accounted for 1.7%. That means that 97.3% of all sales were good ol’ fashioned equity sellers.

Have a great week.

Sincerely,
Roy A. Hernandez
TNG Real Estate Consultants
Cell 949.922.3947

[gravityform id=”22″ title=”true” description=”true”]

Filed Under: Roy's Blog

  • « Previous Page
  • 1
  • 2
  • 3
  • 4
  • 5
  • 6
  • …
  • 14
  • Next Page »

RoyaltyAgent@gmail.com

Search All Houses FOR SALE

Hot Bank Foreclosures & REO

Current Mortgage Rates

[mlrates state="CA" size="narrow"]

Fullerton Homes FOR SALE by Price

$300,000- $500,000
$500,000- $700,000
$700,000- $900,000
$900,000- $1,100,000
$1,100,000 and above

Fullerton Condos FOR SALE by Price

$200,000- $300,000
$300,00- $400,000
$400,000 and above

Our Coverage Areas

Brea Homes FOR SALE

Brea North Hills FOR SALE

Whittier Homes FOR SALE

Fullerton Homes FOR SALE

Placentia Homes FOR SALE

La Habra Homes FOR SALE

Yorba Linda Homes FOR SALE

Anaheim Homes FOR SALE

Brea Special Events

Community Reports

downtown brea

City Information


Brea

Yorba Linda

Placentia

Fullerton

La Habra

Tag Cloud

Anaheim Hills real estate for sale Anaheim house for sale bank owned Brea bank owned for sale Brea community info Brea foreclosure for sale Brea house for sale Brea houses for sale Brea real estate Brea real estate for sale Brea REO Brea REO for sale buyer real estate news foreclosure for sale Fullerton house FOR SALE Fullerton houses for sale Fullerton real estate Fullerton Real Estate For Sale fullerton resort living housing data housing market housing news la habra houses for sale La Habra real estate for sale north orange county for sale north orange county real estate orange county housing info orange county real estate Orange county real estate for sale orange county shadow inventory placentia condos for sale placentia for sale placentia homes for sale placentia houses for sale placentia real estate real estate information real estate news orange county REO for sale REO property for sale seller information whittier houses for sale Yorba Linda for sale Yorba Linda homes for sale yorba linda houses for sale Yorba Linda real estate for sale
The Virtual Realty Group
Roy Hernandez
cell/text (949) 922-3947
RoyaltyAgent @ gmail.com
RoyalAgent.net
BRE#01202958
  • Blog Page
  • I’d like to sell my house
  • About

Copyright © 2025 Website by The Burrell Group · Log in