Buying or Selling Soon? Contact Roy First!
Experience the difference 25 years makes!
 Roy’s Take: the low supply, strong demand, increased affordability, and a strong demographic patch all are the foundation of an exceptionally hot Autumn Market. It will feel like 2020’s Summer Market.
OC Housing Report: A Dive into Housing’s Strengths

The housing market is firing on all cylinders and it appears as if the Autumn Market is going to be the hottest in years.
Strong Fundamentals:
With a low supply, fierce demand, low mortgage rates, and a strong demographic of first-time buyers, the housing market is on strong footing.
It is that time of the year. There are Halloween costumes at Costco. The kids are back in school, online for now. Mornings are a lot darker with the sun rising later. The official start to autumn is not until Tuesday, September 22, but signs are beginning to emerge that the seasons are about to change.
As for Orange County housing, the Autumn Market typically starts at the end of August when the kids head back to school. With the Spring and Summer Markets in the rearview mirror, many families back off their pursuit in purchasing a home. Similarly, fewer homeowners enter the fray and many unsuccessful sellers pull their homes off the market. With the kids back in school, the timing just is not the best for families. Moving can be disruptive while the kids are focusing on their education.
Yet, 2020 has been nothing close to ordinary or typical. What should have been the Spring Market, March through May, turned into one of the slowest springs in memory. The “Stay at Home” order and initial shock and anxiety of the Coronavirus kept buyers from buying and homeowners from selling. As the real estate industry adapted becoming an essential service, and the shock of the virus that included social distancing, sanitizing, and dawning a mask waned, housing surged. The Summer Market became the Spring Market in 2020. It appears as if the Autumn Market is going to be the Summer Market in 2020, not quite as hot as June, July, and August, but still quite busy with homes flying off the market and generating multiple offers. All signs point to an extraordinary September, October, and first half of November.
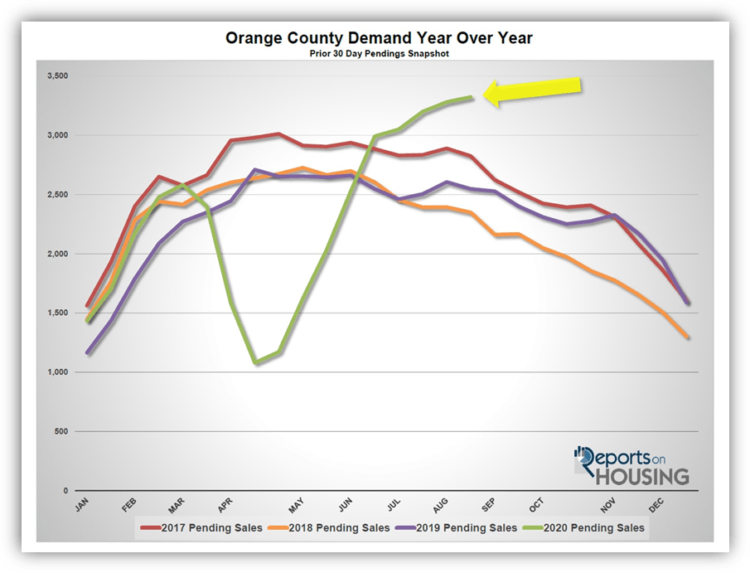
Supply and Demand: The active listing inventory is at its lowest August level since tracking began in 2004, and current demand is at its highest level since 2012. Year over year, the active inventory is down by 41% and demand (the number of pending sales over the prior month) is up by 30%. In taking a deeper look, the hottest price ranges are between $500,000 and $1 million. From $500,000 to $750,000, there are 927 fewer FOR-SALE signs compared to last year, 54% less, yet demand is up by 120, 13% more. Between $750,000 and $1 million, there are 606 fewer active
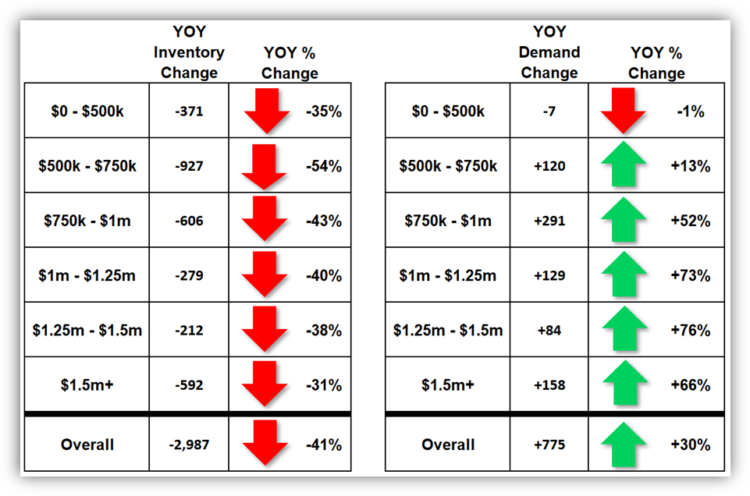
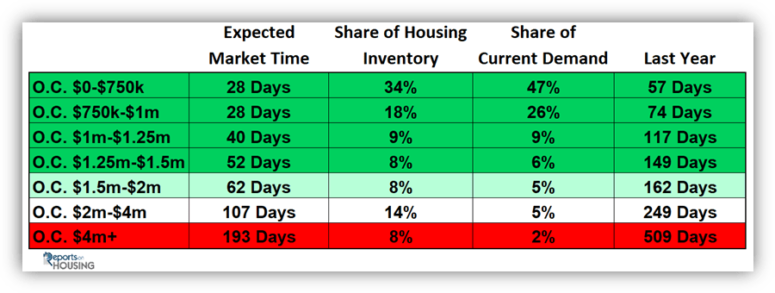
listings, 54% less, and demand is up by 291, 52% higher. These ranges have an Expected Market Time (the time between pounding in the FOR-SALE sign to opening escrow) that is less than 30-days, CRAZY HOT. The upper ranges are experiencing a diminished supply and extraordinarily strong demand. The only demand reading that is off is for properties priced below $500,000, with 7 fewer pending sales year over year, 1% less, yet there are 371 fewer active listings, down by 35%.
For Orange County, the low supply and feverish demand has paved the way for an overall Expected Market Time of 39 days, its lowest level of the year and the best reading since 2013. Anything below 60-days is considered a Hot Seller’s Market with tons of showing, multiple offers, and strong sales prices. Typically, the lowest point of the year occurs between March and April. For it to occur at the end of August is indicative of a strong Autumn Market to come. Any changes in the inventory and demand are customarily a slow evolution.
Affordability: Record low mortgage rates is fueling today’s remarkable demand. With rates dropping below 3%, it is having a significant impact on affordability. In taking into consideration the median income, the median sales price, and mortgage rates over time, according to the California Association of REALTORS® Housing Affordability Index, 25% of Orange County residence could afford the median sales price home during the 2nd quarter of 2020. Compare that to 2007 when it was at 11%. It was at 20% back in 2018 when mortgage rates reached 5%.
In diving a little deeper, a $700,000 mortgage at 3.94%, the average rate in 2019, yields a monthly payment of $3,317. It would be $2,951 per month given today’s 3% interest rate, a savings of $366 per month or $4,392 annually. Lower rates increase a buyer’s buying power and record low rates instigate demand and is an advertisement to purchase.
Demographics: Millennials have surpassed Baby Boomers as the largest living adult generation. The demographics are lining up that favor an increase in home buyer demand. More and more Millennials (ages 23 to 38) are reaching the average first time home buyers age of 32-years old. Millennials number 72.1 million, exceeding both Baby Boomers (ages 55 to 73) at 71.6 million and Generations X (ages 39 to 54) at 65.2 million. That means that housing is heading into a strong demographic patch of first-time home buyers, one that has not been seen since the Baby Boomers were in their prime 30-years ago. A stronger supply of first-time buyers means increased demand for years to come.
Active Listings
The current active inventory decreased by another 3% in the last two weeks.
The active listing inventory shed 129 homes in the past two-weeks, down 3%, and now sits at 4,320, the lowest level for August since tracking began in 2004. COVID-19 is no longer suppressing homeowners from coming on the market; yet,
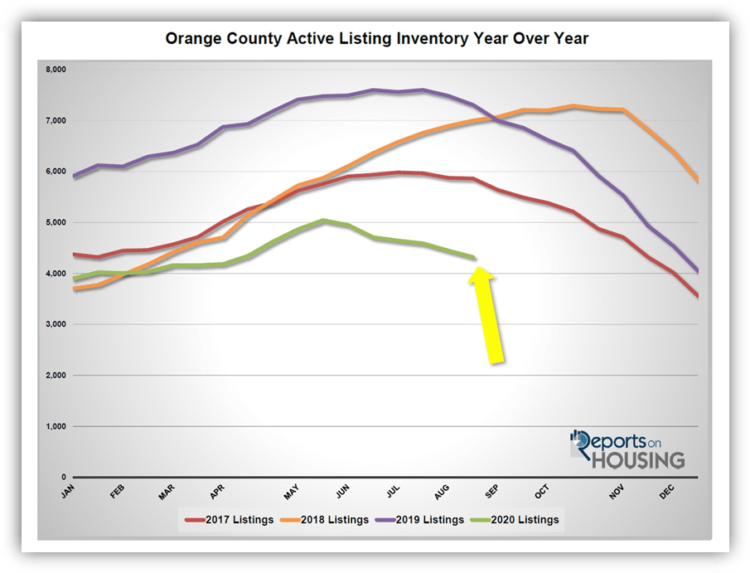
from May through June there were 27% fewer FOR-SALE signs compared to 2019, meaning 4,318 missing sellers. That has contributed to the current unprecedented low inventory. Based upon where the inventory is today, 2021 is going to start with a record low number of homes.
Last year at this time, there were 7,307 homes on the market, 2,987 additional homes, or 69% more. There were a lot more choices for buyers last year.
Demand:
Demand increased by 1% in the past two weeks.
Demand, the number of new pending sales over the prior month, increased from 3,281 to 3,323, an additional 42 pending sales, up 1% in two weeks. This is the highest demand reading since September 2012, eight years ago. It is arguably higher today because back in 2012 there was a flood of short sales that were placed into escrow, yet many never closed. The closing percentages are greater this year as there are virtually no short sales.
Demand has not quite reached a height for 2020. We can expect demand to soften a bit as housing moves deeper into the Autumn Market, now through Thanksgiving, yet it will not slow as much due to the current low mortgage rate environment and continued pent up demand.
Last year, demand was at 2,548, that is 775 fewer pending sales compared to today, or 23% less.
In the past two-weeks the Expected Market Time dropped from 41 to 39 days, a Hot Seller’s Market (less than 60 days), where sellers get to call the shots during the negotiating process and home values are on the rise. This is the strongest level since June 2013. Last year the Expected Market Time was at 86 days, much slower than today.
Luxury End
The luxury market continued to improve with a drop in the supply and a rise in demand.
In the past two-weeks, demand for homes above $1.25 million increased by 16 pending sales, up 3%, and now totals 591. Luxury demand continues to be at its hottest level in years. It is not jumping to higher levels, but it is clawing its way higher and creating an even hotter luxury market. The luxury home inventory shed 54 homes, a 3% drop, and now totals 1,657. With a small rise in demand coupled with a slight drop in the supply, the overall Expected Market Time for homes priced above $1.25 million decreased from 89 to 84 days in the past couple of weeks. The luxury market continues to fire on all cylinders.
Year over year, luxury demand is up by 242 pending sales, or 69%, and the active luxury listing inventory is down by 804 homes, or 33%. The Expected Market Time last year was at 212 days, drastically slower than today.
For homes priced between $1.25 million and $1.5 million, in the past two-weeks, the Expected Market Time increased from 49 to 52 days. For homes priced between $1.5 million and $2 million, the Expected Market Time decreased from 68 to 62 days. For homes priced between $2 million and $4 million, the Expected Market Time decreased from 115 to 107 days. For homes priced above $4 million, the Expected Market Time decreased from 262 to 193 days. At 193 days, a seller would be looking at placing their home into escrow around March 2021.

Leave a Reply